Log entries by program:
| Program name | Lines | %Lines | Size | %Size |
|---|---|---|---|---|
| innd | 97045 | 54.9% | 10.8 MB | 51.6% |
| inn | 46119 | 26.1% | 5.5 MB | 26.2% |
| nnrpd | 32893 | 18.6% | 4.6 MB | 21.9% |
| innfeed | 617 | 0.3% | 72.8 KB | 0.3% |
| nocem | 8 | 0.0% | 1.1 KB | 0.0% |
| controlchan | 1 | 0.0% | 0.1 KB | 0.0% |
| TOTAL: 6 | 176683 | 100.0% | 21.0 MB | 100.0% |
History cache:
| Reason | Count | %Count |
|---|---|---|
| Do not exist | 45831 | 53.5% |
| Negative hits | 39752 | 46.4% |
| Positive hits | 15 | 0.0% |
| Cache misses | 1 | 0.0% |
| TOTAL: 4 | 85599 | 100.0% |
INND timer:
| Code region | Time | Pct | Invoked | Min(ms) | Avg(ms) | Max(ms) |
|---|---|---|---|---|---|---|
| article cancel | 00:00:00.939 | 0.0% | 80 | 0.000 | 11.738 | 51.000 |
| article cleanup | 00:00:00.353 | 0.0% | 46577 | 0.000 | 0.008 | 0.074 |
| article logging | 00:00:03.110 | 0.0% | 46815 | 0.000 | 0.066 | 1.197 |
| article parse | 00:00:45.812 | 0.0% | 2634620 | 0.000 | 0.017 | 0.045 |
| article write | 00:13:05.444 | 0.8% | 44901 | 2.219 | 17.493 | 40.852 |
| artlog/artcncl | 00:00:00.000 | 0.0% | 14 | 0.000 | 0.000 | 0.000 |
| data move | 00:00:06.594 | 0.0% | 2820787 | 0.000 | 0.002 | 0.008 |
| hisgrep/artcncl | 00:00:00.229 | 0.0% | 91 | 0.000 | 2.516 | 17.000 |
| hishave/artcncl | 00:00:00.000 | 0.0% | 16 | 0.000 | 0.000 | 0.000 |
| history grep | 00:00:00.000 | 0.0% | 0 | 0.000 | 0.000 | 0.000 |
| history lookup | 00:03:56.321 | 0.2% | 87065 | 0.126 | 2.714 | 17.000 |
| history sync | 00:00:12.607 | 0.0% | 452 | 0.000 | 27.892 | 598.000 |
| history write | 00:06:35.316 | 0.4% | 46577 | 1.206 | 8.487 | 16.043 |
| idle | 26:00:12.133 | 96.2% | 2430619 | 2.791 | 38.514 | 6969.174 |
| nntp read | 00:00:34.666 | 0.0% | 2674843 | 0.000 | 0.013 | 0.041 |
| overview write | 00:02:52.507 | 0.2% | 44901 | 0.151 | 3.842 | 38.250 |
| perl filter | 00:00:07.970 | 0.0% | 45391 | 0.000 | 0.176 | 0.316 |
| python filter | 00:31:58.167 | 2.0% | 78845 | 0.968 | 24.328 | 35.676 |
| site send | 00:00:01.583 | 0.0% | 77286 | 0.000 | 0.020 | 0.077 |
| TOTAL: 27:01:26.921 | 27:00:33.751 | 99.9% | - | - | - | - |
INNfeed timer:
| Code region | Time | Pct | Invoked | Min(ms) | Avg(ms) | Max(ms) |
|---|---|---|---|---|---|---|
| article new | 00:00:00.091 | 0.0% | 37189 | 0.000 | 0.002 | 0.006 |
| article prepare | 00:00:00.040 | 0.0% | 126272 | 0.000 | 0.000 | 0.001 |
| article read | 00:00:28.897 | 0.0% | 31561 | 0.079 | 0.916 | 4.322 |
| backlog stats | 00:00:00.466 | 0.0% | 1398658 | 0.000 | 0.000 | 0.037 |
| callbacks | 00:00:00.000 | 0.0% | 0 | 0.000 | 0.000 | 0.000 |
| data read | 00:00:00.834 | 0.0% | 64509 | 0.000 | 0.013 | 0.027 |
| data write | 00:04:17.898 | 0.3% | 1335869 | 0.000 | 0.193 | 0.497 |
| idle | 26:51:35.731 | 99.7% | 1398658 | 2.645 | 69.135 | 25070.833 |
| status file | 00:00:00.043 | 0.0% | 77 | 0.000 | 0.558 | 7.000 |
| TOTAL: 26:56:31.715 | 26:56:24.000 | 100.0% | - | - | - | - |
nnrpd timer:
| Code region | Time | Pct | Invoked | Min(ms) | Avg(ms) | Max(ms) |
|---|---|---|---|---|---|---|
| idle | 00:00:00.000 | 0.0% | 0 | 0.000 | 0.000 | 0.000 |
| newnews | 00:00:00.000 | 0.0% | 0 | 0.000 | 0.000 | 0.000 |
| nntpwrite | 00:00:05.044 | 0.0% | 98613 | 0.000 | 0.051 | 11.062 |
| readart | 00:00:00.539 | 0.0% | 51 | 7.818 | 10.569 | 27.857 |
| TOTAL: 31:48:43.853 | 00:00:05.583 | 0.0% | - | - | - | - |
Control commands to INND:
| Command | Number |
|---|---|
| flush | 20 |
| flushlogs | 2 |
| go | 2 |
| logmode | 2 |
| lowmark | 1 |
| mode | 166 |
| name | 2 |
| pause | 2 |
| paused | 2 |
| reload | 4 |
| reserve | 2 |
| TOTAL: 11 | 205 |
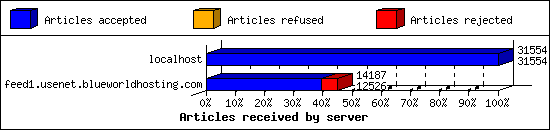
Incoming Feeds (INN):
| Server | Connects | Offered | Taken | Refused | Reject | %Accpt | Elapsed | |
|---|---|---|---|---|---|---|---|---|
| 1 | localhost | 31558 | 31554 | 31554 | 0 | 0 | 100% | 01:10:01 |
| 2 | feed1.usenet.blueworldhosting.com | 30 | 14187 | 12526 | 0 | 1661 | 88% | 29:24:49 |
| TOTAL: 2 | 31588 | 45741 | 44080 | 0 | 1661 | 96% | 30:34:50 | |
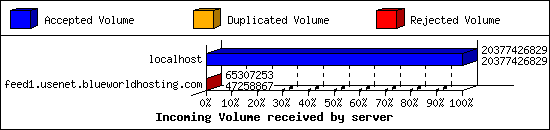
Incoming Volume (INN):
| Server | AcceptVol | DupVol | RejVol | TotalVol | %Acc | Vol/Art | |
|---|---|---|---|---|---|---|---|
| 1 | localhost | 19.0 GB | 0.0 KB | 0.0 KB | 19.0 GB | 100% | 630.7 KB |
| 2 | feed1.usenet.blueworldhosting.com | 45.1 MB | 0.0 KB | 17.2 MB | 62.3 MB | 72% | 4.5 KB |
| TOTAL: 2 | 19.0 GB | 0.0 KB | 17.2 MB | 19.0 GB | 99% | 436.4 KB | |
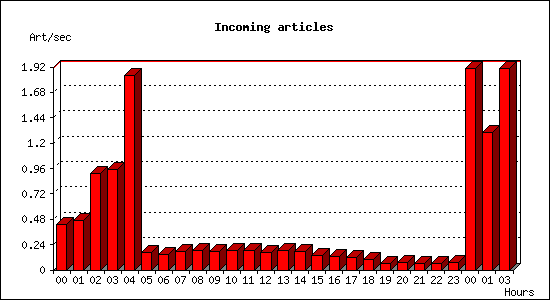
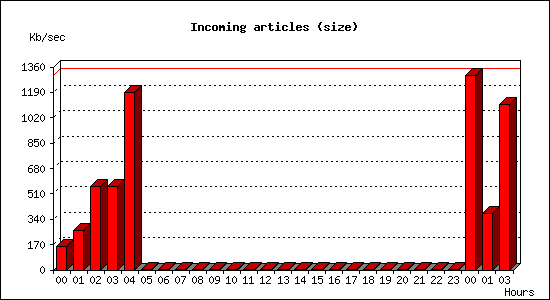
Incoming articles:
| Date | Articles | %Arts | Art/sec | Size | %Size | KB/sec |
|---|---|---|---|---|---|---|
| Jun 6 00:00:01 - 00:59:59 | 1558 | 3.5% | 0.43 | 558.5 MB | 2.9% | 158.90 |
| Jun 6 01:00:00 - 01:59:59 | 1697 | 3.8% | 0.47 | 937.6 MB | 4.8% | 266.68 |
| Jun 6 02:00:00 - 02:59:59 | 3299 | 7.5% | 0.92 | 1.9 GB | 10.1% | 560.35 |
| Jun 6 03:00:00 - 03:59:59 | 3414 | 7.7% | 0.95 | 1.9 GB | 10.1% | 561.03 |
| Jun 6 04:00:00 - 04:59:59 | 6613 | 15.0% | 1.84 | 4.1 GB | 21.4% | 1186.37 |
| Jun 6 05:00:00 - 05:59:59 | 598 | 1.4% | 0.17 | 2.1 MB | 0.0% | 0.61 |
| Jun 6 06:00:00 - 06:59:59 | 531 | 1.2% | 0.15 | 1.6 MB | 0.0% | 0.45 |
| Jun 6 07:00:00 - 07:59:59 | 629 | 1.4% | 0.17 | 2.1 MB | 0.0% | 0.61 |
| Jun 6 08:00:00 - 08:59:59 | 663 | 1.5% | 0.18 | 3.7 MB | 0.0% | 1.04 |
| Jun 6 09:00:00 - 09:59:59 | 636 | 1.4% | 0.18 | 2.1 MB | 0.0% | 0.60 |
| Jun 6 10:00:00 - 10:59:59 | 675 | 1.5% | 0.19 | 2.5 MB | 0.0% | 0.70 |
| Jun 6 11:00:00 - 11:59:59 | 677 | 1.5% | 0.19 | 2.1 MB | 0.0% | 0.61 |
| Jun 6 12:00:00 - 12:59:59 | 602 | 1.4% | 0.17 | 2.6 MB | 0.0% | 0.75 |
| Jun 6 13:00:00 - 13:59:59 | 674 | 1.5% | 0.19 | 2.0 MB | 0.0% | 0.56 |
| Jun 6 14:00:00 - 14:59:59 | 614 | 1.4% | 0.17 | 2.4 MB | 0.0% | 0.68 |
| Jun 6 15:00:00 - 15:59:59 | 498 | 1.1% | 0.14 | 1.9 MB | 0.0% | 0.55 |
| Jun 6 16:00:00 - 16:59:59 | 463 | 1.0% | 0.13 | 1.6 MB | 0.0% | 0.46 |
| Jun 6 17:00:00 - 17:59:59 | 420 | 1.0% | 0.12 | 1.6 MB | 0.0% | 0.45 |
| Jun 6 18:00:00 - 18:59:59 | 371 | 0.8% | 0.10 | 1.8 MB | 0.0% | 0.52 |
| Jun 6 19:00:00 - 19:59:59 | 221 | 0.5% | 0.06 | 989.4 KB | 0.0% | 0.27 |
| Jun 6 20:00:00 - 20:59:59 | 243 | 0.5% | 0.07 | 972.5 KB | 0.0% | 0.27 |
| Jun 6 21:00:00 - 21:59:59 | 219 | 0.5% | 0.06 | 1.4 MB | 0.0% | 0.41 |
| Jun 6 22:00:00 - 22:59:59 | 233 | 0.5% | 0.06 | 857.6 KB | 0.0% | 0.24 |
| Jun 6 23:00:00 - 23:59:59 | 264 | 0.6% | 0.07 | 1.0 MB | 0.0% | 0.29 |
| Jun 7 00:00:00 - 00:59:59 | 6845 | 15.5% | 1.90 | 4.5 GB | 23.6% | 1305.99 |
| Jun 7 01:00:00 - 01:59:59 | 4668 | 10.6% | 1.30 | 1.3 GB | 6.9% | 381.63 |
| Jun 7 02:00:00 - 03:00:00 | 6865 | 15.5% | 1.91 | 3.8 GB | 20.0% | 1109.68 |
| TOTAL: 26:59:59 | 44190 | 100.0% | 0.45 | 19.0 GB | 100.0% | 205.21 |
Sites sending bad articles:
| Server | Total | Group | Dist | Duplic | Unapp | TooOld | Site | Line | Other | |
|---|---|---|---|---|---|---|---|---|---|---|
| 1 | feed1.usenet.blueworldhosting.com | 1915 | 487 | 0 | 0 | 2 | 0 | 0 | 0 | 1426 |
| TOTAL: 1 | 1915 | 487 | 0 | 0 | 2 | 0 | 0 | 0 | 1426 | |
Unwanted newsgroups [Top 20]:
| Newsgroup | Count |
|---|---|
| talk.ukrainian.tg | 316 |
| talk.english.tg | 84 |
| talk.generic.ua.ws | 26 |
| talk.english.tw | 24 |
| alt.politics.liberal | 8 |
| fr.petites-annonces.divers | 6 |
| rec | 5 |
| list.postfix.users | 4 |
| talk.from.diary | 2 |
| news.oriens-occasus.ru | 2 |
| talk.from.war.diary | 2 |
| alt.sounds.audiobooks | 1 |
| rocksolid.feeds.tech | 1 |
| a.b.mp3.audiobooks | 1 |
| alt.cooking-chien | 1 |
| alt.culture.zippies | 1 |
| paizedaquimbandagmail.com | 1 |
| soc.men.alt.feminism | 1 |
| alt.wrestling | 1 |
| TOTAL: 19 | 487 |
Supposedly-moderated groups with unmoderated postings [Top 20]:
| Groups | Count |
|---|---|
| bit.listserv.catholic | 2 |
| TOTAL: 1 | 2 |
INND Python filter [Top 20]:
| Reason | Count |
|---|---|
| EMP Body Reject | 648 |
| Bad From (Test User <test-user@nospam.example>) | 324 |
| EMP PHL Reject | 103 |
| AUK Bad Crosspost | 53 |
| EMP PHN Reject | 27 |
| Bad Subject (echolot ping - ignore) | 14 |
| Binary (yEnc) | 11 |
| Crosspost Low Limit Exceeded | 1 |
| Binary (base64) | 1 |
| Bad Subject (M6I635Y+W5paw6Lqr5Lu96K+B77yM5omY56aP) | 1 |
| Binary (uuEnc) | 1 |
| Bad Subject (MyBXZUNoYXQ6IG15MjMyMjP) | 1 |
| Bad Subject (Modi paradise - FIR Against 5 Policemen for Brutal Custodial Torture of Man in UP) | 1 |
| TOTAL: 13 | 1186 |
NoCeM on Spool:
| Id | Good | Bad | Unique | Total |
|---|---|---|---|---|
| bleachbot@httrack.com | 5 | 0 | 5 | 5 |
| TOTAL: 1 | 5 | 0 | 5 | 5 |
Miscellaneous innd statistics [Top 10]:
| Event | Server | Number |
|---|---|---|
| Including strange strings | ||
| feed1.usenet.blueworldhosting.com | 240 | |
| TOTAL: 1 | 240 | |
| TOTAL: 1 | 240 | |
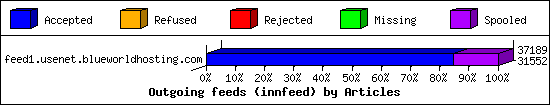
Outgoing Feeds (innfeed) by Articles:
| Server | Offered | Taken | Refused | Reject | Miss | Spool | %Took | Elapsed | |
|---|---|---|---|---|---|---|---|---|---|
| 1 | feed1.usenet.blueworldhosting.com | 31605 | 31552 | 0 | 2 | 0 | 5635 | 99% | 04:42:57 |
| TOTAL: 1 | 31605 | 31552 | 0 | 2 | 0 | 5635 | 99% | 04:42:57 | |
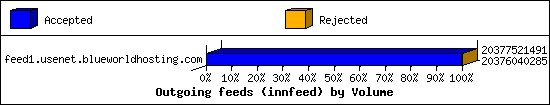
Outgoing Feeds (innfeed) by Volume:
| Server | AcceptVol | RejectVol | TotalVol | Volume/sec | Vol/Art | Elapsed | |
|---|---|---|---|---|---|---|---|
| 1 | feed1.usenet.blueworldhosting.com | 19.0 GB | 1.4 MB | 19.0 GB | 1.1 MB/s | 630.7 KB | 04:42:57 |
| TOTAL: 1 | 19.0 GB | 1.4 MB | 19.0 GB | 1.1 MB/s | 630.7 KB | 04:42:57 | |
NNRP readership statistics:
| System | Conn | Arts | Size | Groups | Post | Rej | Elapsed | |
|---|---|---|---|---|---|---|---|---|
| 1 | 023-084-030-207.res.spectrum.com | 5 | 51 | 179.2 KB | 63 | 0 | 0 | 02:45:54 |
| 2 | 192.168.1.146 | 133 | 0 | 0.0 KB | 0 | 32343 | 140 | 29:02:48 |
| TOTAL: 2 | 138 | 51 | 179.2 KB | 63 | 32343 | 140 | 31:48:42 | |
NNRP readership statistics (by domain):
| System | Conn | Arts | Size | Groups | Post | Rej | Elapsed | |
|---|---|---|---|---|---|---|---|---|
| 1 | *.res.spectrum.com | 5 | 51 | 179.2 KB | 63 | 0 | 0 | 02:45:54 |
| 2 | unresolved | 133 | 0 | 0.0 KB | 0 | 32343 | 140 | 29:02:48 |
| TOTAL: 2 | 138 | 51 | 179.2 KB | 63 | 32343 | 140 | 31:48:42 | |
NNRP auth users [Top 20]:
| User | Conn |
|---|---|
| jesse | 138 |
| TOTAL: 1 | 138 |
NNRP total resource statistics [Top 20]:
| System | User(ms) | System(ms) | Idle(ms) | Elapsed |
|---|---|---|---|---|
| 192.168.1.146 | 652.271 | 714.458 | 1.887 | 29:02:48 |
| 023-084-030-207.res.spectrum.com | 0.603 | 0.356 | 0.044 | 02:45:54 |
| TOTAL: 2 | 652.874 | 714.814 | 1.931 | 31:48:42 |
NNRP client timeouts [Top 20]:
| System | Conn | Peer |
|---|---|---|
| 192.168.1.146 | 54 | 54 |
| 023-084-030-207.res.spectrum.com | 5 | 0 |
| TOTAL: 2 | 59 | 54 |
Newsgroup request counts (by hierarchy):
| Hierarchy | Count | Pct | |
|---|---|---|---|
| 1 | news | 50 | 79.4% |
| 2 | alt | 13 | 20.6% |
| TOTAL: 2 | 63 | 100.0% | |
Newsgroup request counts (by newsgroup) [Top 100]:
| Newsgroup | Count | |
|---|---|---|
| 1 | news.software.readers | 19 |
| 2 | news.admin.net-abuse.email | 12 |
| 3 | alt.folklore.computers | 12 |
| 4 | news.admin.net-abuse.usenet | 7 |
| 5 | news.admin.net-abuse.misc | 6 |
| 6 | news.lists.misc | 4 |
| 7 | news.announce.important | 1 |
| 8 | alt.comp.issues.security | 1 |
| 9 | news.answers | 1 |
| TOTAL: 9 | 63 | |