Unknown entries from news log file:
First 13 / 13 lines (100.0%)
Log entries by program:
| Program name | Lines | %Lines | Size | %Size |
|---|---|---|---|---|
| innd | 131242 | 44.3% | 14.2 MB | 41.2% |
| inn | 86601 | 29.2% | 10.1 MB | 29.3% |
| nnrpd | 78282 | 26.4% | 10.1 MB | 29.3% |
| innfeed | 447 | 0.2% | 53.5 KB | 0.2% |
| controlchan | 2 | 0.0% | 0.1 KB | 0.0% |
| nocem | 2 | 0.0% | 0.1 KB | 0.0% |
| TOTAL: 6 | 296576 | 100.0% | 34.5 MB | 100.0% |
History cache:
| Reason | Count | %Count |
|---|---|---|
| Do not exist | 85204 | 55.6% |
| Negative hits | 68098 | 44.4% |
| Cache misses | 21 | 0.0% |
| Positive hits | 17 | 0.0% |
| TOTAL: 4 | 153340 | 100.0% |
INND timer:
| Code region | Time | Pct | Invoked | Min(ms) | Avg(ms) | Max(ms) |
|---|---|---|---|---|---|---|
| article cancel | 00:00:08.126 | 0.0% | 6963 | 0.000 | 1.167 | 644.000 |
| article cleanup | 00:00:00.681 | 0.0% | 85408 | 0.000 | 0.008 | 0.035 |
| article logging | 00:00:04.761 | 0.0% | 85590 | 0.000 | 0.056 | 0.310 |
| article parse | 00:00:57.033 | 0.1% | 3370287 | 0.002 | 0.017 | 0.024 |
| article write | 00:09:20.198 | 0.7% | 75845 | 0.488 | 7.386 | 29.918 |
| artlog/artcncl | 00:00:00.000 | 0.0% | 37 | 0.000 | 0.000 | 0.000 |
| data move | 00:00:06.669 | 0.0% | 3642058 | 0.000 | 0.002 | 0.005 |
| hisgrep/artcncl | 00:00:07.093 | 0.0% | 7000 | 0.000 | 1.013 | 16.000 |
| hishave/artcncl | 00:00:00.000 | 0.0% | 37 | 0.000 | 0.000 | 0.000 |
| history grep | 00:00:00.000 | 0.0% | 0 | 0.000 | 0.000 | 0.000 |
| history lookup | 00:04:28.171 | 0.3% | 153650 | 0.028 | 1.745 | 4.574 |
| history sync | 00:00:06.003 | 0.0% | 380 | 0.500 | 15.797 | 207.000 |
| history write | 00:09:12.978 | 0.7% | 85408 | 0.353 | 6.475 | 18.554 |
| idle | 22:21:53.210 | 95.1% | 3267168 | 2.078 | 24.643 | 2087.024 |
| nntp read | 00:00:46.573 | 0.1% | 3416507 | 0.003 | 0.014 | 0.034 |
| overview write | 00:02:17.618 | 0.2% | 75845 | 0.316 | 1.814 | 22.393 |
| perl filter | 00:00:10.393 | 0.0% | 81249 | 0.000 | 0.128 | 0.283 |
| python filter | 00:39:49.901 | 2.8% | 148133 | 0.608 | 16.133 | 35.307 |
| site send | 00:00:02.713 | 0.0% | 117247 | 0.000 | 0.023 | 0.063 |
| TOTAL: 23:31:07.724 | 23:29:32.121 | 99.9% | - | - | - | - |
INNfeed timer:
| Code region | Time | Pct | Invoked | Min(ms) | Avg(ms) | Max(ms) |
|---|---|---|---|---|---|---|
| article new | 00:00:00.094 | 0.0% | 41430 | 0.000 | 0.002 | 0.007 |
| article prepare | 00:00:00.044 | 0.0% | 165724 | 0.000 | 0.000 | 0.001 |
| article read | 00:00:04.702 | 0.0% | 41430 | 0.000 | 0.113 | 0.170 |
| backlog stats | 00:00:00.440 | 0.0% | 1651097 | 0.000 | 0.000 | 0.026 |
| callbacks | 00:00:00.000 | 0.0% | 0 | 0.000 | 0.000 | 0.000 |
| data read | 00:00:01.165 | 0.0% | 84607 | 0.000 | 0.014 | 0.095 |
| data write | 00:04:11.007 | 0.3% | 1562759 | 0.000 | 0.161 | 0.185 |
| idle | 23:21:42.926 | 99.7% | 1651097 | 5.788 | 50.938 | 23325.222 |
| status file | 00:00:00.046 | 0.0% | 97 | 0.000 | 0.474 | 3.000 |
| TOTAL: 23:26:09.050 | 23:26:00.424 | 100.0% | - | - | - | - |
nnrpd timer:
| Code region | Time | Pct | Invoked | Min(ms) | Avg(ms) | Max(ms) |
|---|---|---|---|---|---|---|
| hisgrep | 00:00:00.119 | 0.0% | 29 | 1.217 | 4.103 | 24.000 |
| idle | 00:00:02.976 | 0.0% | 34508 | 0.000 | 0.086 | 1.200 |
| newnews | 00:00:00.000 | 0.0% | 0 | 0.000 | 0.000 | 0.000 |
| nntpwrite | 00:01:32.997 | 0.1% | 241481 | 0.000 | 0.385 | 324.625 |
| readart | 00:00:01.183 | 0.0% | 141 | 0.000 | 8.390 | 73.000 |
| TOTAL: 21:26:43.280 | 00:01:37.275 | 0.1% | - | - | - | - |
Control commands to INND:
| Command | Number |
|---|---|
| flush | 5 |
| flushlogs | 2 |
| go | 2 |
| logmode | 2 |
| lowmark | 1 |
| mode | 144 |
| name | 2 |
| pause | 2 |
| paused | 2 |
| reload | 2 |
| reserve | 2 |
| throttle | 2 |
| xexec | 1 |
| TOTAL: 13 | 169 |
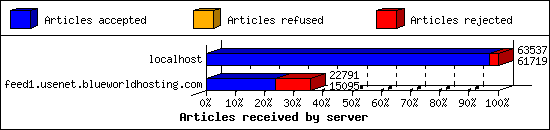
Incoming Feeds (INN):
| Server | Connects | Offered | Taken | Refused | Reject | %Accpt | Elapsed | |
|---|---|---|---|---|---|---|---|---|
| 1 | localhost | 41769 | 63537 | 61719 | 1 | 1817 | 97% | 14:47:52 |
| 2 | feed1.usenet.blueworldhosting.com | 147 | 22791 | 15095 | 0 | 7696 | 66% | 76:31:00 |
| TOTAL: 2 | 41916 | 86328 | 76814 | 1 | 9513 | 88% | 91:18:52 | |
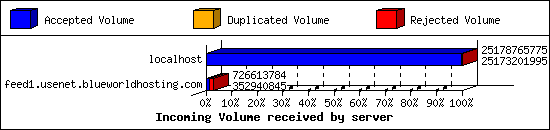
Incoming Volume (INN):
| Server | AcceptVol | DupVol | RejVol | TotalVol | %Acc | Vol/Art | |
|---|---|---|---|---|---|---|---|
| 1 | localhost | 23.4 GB | 0.0 KB | 5.3 MB | 23.4 GB | 99% | 387.0 KB |
| 2 | feed1.usenet.blueworldhosting.com | 336.6 MB | 0.0 KB | 356.4 MB | 693.0 MB | 48% | 31.1 KB |
| TOTAL: 2 | 23.8 GB | 0.0 KB | 361.7 MB | 24.1 GB | 98% | 293.1 KB | |
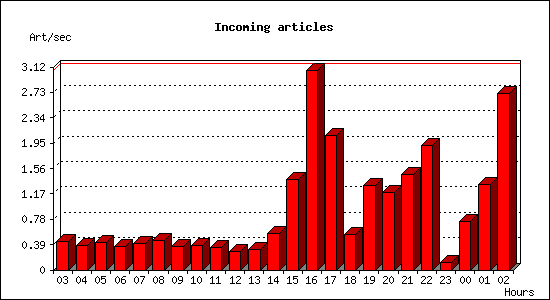
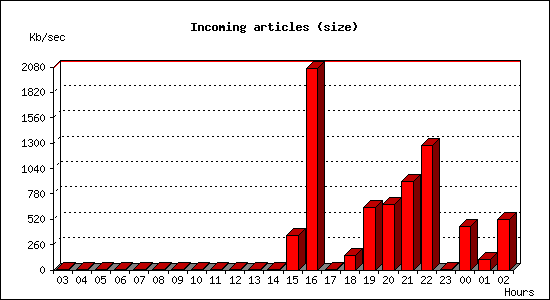
Incoming articles:
| Date | Articles | %Arts | Art/sec | Size | %Size | KB/sec |
|---|---|---|---|---|---|---|
| Jun 11 03:00:00 - 03:59:59 | 1575 | 2.1% | 0.44 | 4.6 MB | 0.0% | 1.32 |
| Jun 11 04:00:00 - 04:59:59 | 1361 | 1.8% | 0.38 | 4.5 MB | 0.0% | 1.29 |
| Jun 11 05:00:00 - 05:59:59 | 1533 | 2.0% | 0.43 | 4.4 MB | 0.0% | 1.25 |
| Jun 11 06:00:00 - 06:59:59 | 1301 | 1.7% | 0.36 | 3.7 MB | 0.0% | 1.06 |
| Jun 11 07:00:00 - 07:59:59 | 1490 | 1.9% | 0.41 | 4.3 MB | 0.0% | 1.22 |
| Jun 11 08:00:00 - 08:59:59 | 1630 | 2.1% | 0.45 | 4.5 MB | 0.0% | 1.27 |
| Jun 11 09:00:00 - 09:59:59 | 1274 | 1.7% | 0.35 | 4.4 MB | 0.0% | 1.24 |
| Jun 11 10:00:00 - 10:59:59 | 1332 | 1.7% | 0.37 | 3.6 MB | 0.0% | 1.02 |
| Jun 11 11:00:00 - 11:59:59 | 1240 | 1.6% | 0.34 | 3.8 MB | 0.0% | 1.07 |
| Jun 11 12:00:00 - 12:59:59 | 1044 | 1.4% | 0.29 | 2.8 MB | 0.0% | 0.81 |
| Jun 11 13:00:00 - 13:59:59 | 1113 | 1.5% | 0.31 | 4.3 MB | 0.0% | 1.22 |
| Jun 11 14:00:00 - 14:59:59 | 1993 | 2.6% | 0.55 | 6.8 MB | 0.0% | 1.94 |
| Jun 11 15:00:00 - 15:59:59 | 4981 | 6.5% | 1.38 | 1.2 GB | 5.1% | 349.73 |
| Jun 11 16:00:00 - 16:59:59 | 11016 | 14.4% | 3.06 | 7.1 GB | 29.7% | 2059.61 |
| Jun 11 17:00:00 - 17:59:59 | 7427 | 9.7% | 2.06 | 18.1 MB | 0.1% | 5.16 |
| Jun 11 18:00:00 - 18:59:59 | 1950 | 2.5% | 0.54 | 540.0 MB | 2.2% | 153.60 |
| Jun 11 19:00:00 - 19:59:59 | 4695 | 6.1% | 1.30 | 2.2 GB | 9.2% | 639.40 |
| Jun 11 20:00:00 - 20:59:59 | 4284 | 5.6% | 1.19 | 2.3 GB | 9.6% | 666.08 |
| Jun 11 21:00:00 - 21:59:59 | 5276 | 6.9% | 1.47 | 3.1 GB | 13.1% | 908.76 |
| Jun 11 22:00:00 - 22:59:59 | 6879 | 9.0% | 1.91 | 4.4 GB | 18.4% | 1272.76 |
| Jun 11 23:00:00 - 23:59:59 | 421 | 0.5% | 0.12 | 13.7 MB | 0.1% | 3.90 |
| Jun 12 00:00:00 - 00:59:59 | 2659 | 3.5% | 0.74 | 1.5 GB | 6.4% | 443.81 |
| Jun 12 01:00:00 - 01:59:59 | 4743 | 6.2% | 1.32 | 392.3 MB | 1.6% | 111.59 |
| Jun 12 02:00:00 - 02:34:00 | 5539 | 7.2% | 2.72 | 1.0 GB | 4.3% | 522.46 |
| TOTAL: 23:34:00 | 76756 | 100.0% | 0.90 | 23.8 GB | 100.0% | 293.86 |
Sites sending bad articles:
| Server | Total | Group | Dist | Duplic | Unapp | TooOld | Site | Line | Other | |
|---|---|---|---|---|---|---|---|---|---|---|
| 1 | feed1.usenet.blueworldhosting.com | 7991 | 5418 | 0 | 0 | 1 | 0 | 0 | 0 | 2572 |
| 2 | localhost | 1817 | 0 | 5 | 0 | 0 | 0 | 0 | 0 | 1812 |
| TOTAL: 2 | 9808 | 5418 | 5 | 0 | 1 | 0 | 0 | 0 | 4384 | |
Unwanted newsgroups [Top 20]:
| Newsgroup | Count |
|---|---|
| alt.binaries.bloaf | 4680 |
| talk.ukrainian.tg | 330 |
| alt.binaries.ftd | 135 |
| al.binaries.test | 84 |
| talk.english.tg | 57 |
| talk.generic.ua.ws | 29 |
| talk.english.tw | 11 |
| alt.binaries.e-book | 8 |
| alt.binaries.howard-stern | 7 |
| alt.binaries.pictures.rail | 7 |
| alt.binaries.pictures.wallpaper | 6 |
| alt.binaries.pictures.sierra | 6 |
| alt.binaries.games.adult | 4 |
| alt.binaries.pictures.e | 4 |
| alt.binaries.pictures.purebeauty | 3 |
| alt.binaries.pictures.teen-starlets | 3 |
| wolfsburg.test | 3 |
| alt.binaries.pictures.scenic | 3 |
| alt.binaries.pictures.erotica.fetish.latex | 3 |
| finet.binaries.keskustelu | 3 |
| TOTAL: 49 | 5418 |
Unwanted distributions [Top 20]:
| Distribution | Count |
|---|---|
| local | 5 |
| TOTAL: 1 | 5 |
Supposedly-moderated groups with unmoderated postings [Top 20]:
| Groups | Count |
|---|---|
| bit.listserv.catholic | 1 |
| TOTAL: 1 | 1 |
INND Python filter [Top 20]:
| Reason | Count |
|---|---|
| EMP PHN Reject | 2052 |
| EMP Body Reject | 692 |
| Bad From (Test User <test-user@nospam.example>) | 283 |
| EMP PHL Reject | 229 |
| EMP FSL Reject | 26 |
| Bad Subject (M-QV-6LG55LOTI745A4H7XN7UWYVGEFMAEOSP) | 20 |
| Bad Subject (MVIC6RG6WHLH5RLPV7UDP) | 20 |
| Bad Subject (M-KSKZG5BUQR5AQIKFE565AE5PMKHZRJGSXVVA2JP) | 20 |
| Bad Subject (M-IR-AOI5GAZPT3JNSIFCUEAAUIWROW7VQOYZSWESYOMJV4DP) | 20 |
| Bad Subject (M-BY-46LRSLV3SNAJREOLUXLH5BYGIIANJX57FXVHVNQCXEQP) | 20 |
| Bad Subject (MI-BL-BHKH4K7SRVVGHFF6E5RBTWENKMY4AOTTUVGUXJP) | 20 |
| Bad Subject (MHI64PD5AOYCP) | 20 |
| Bad Subject (MIY4CLRCCYX5NJCFM7KRP) | 20 |
| Bad Subject (MR-2R2VS3FCAQEI3SKDAL2KLG5JXTCO5AYVCSNWDQ3C34P) | 20 |
| Bad Subject (MZ-AL-FGJDDZC6AFPOETZUBEAEDUEPG4BIECE3RFIQ6FMXO5ULMP) | 20 |
| Bad Subject (M-Z3-47CRFELLNOQ5W2FWI5PFUXDFRTZYQZZTF4ZZB4TX7WF6TYP) | 20 |
| Bad Subject (M-EH-IWH7ERM2E6VHC6JE3WYOUBEWEPQXL4L5357P) | 20 |
| Bad Subject (M-ULTTLNIXDDQ6J4EPW5YC2XEOLD6HYP6RVZSVB7ZHO3UP) | 20 |
| Bad Subject (M-PX-JIIIGCA5RQC5NAIJ3HFCDOLXVABKL6PD3P) | 20 |
| Bad Subject (M-ZD-IUHEG47D5WPI4G5AYTP) | 20 |
| TOTAL: 57 | 4200 |
Miscellaneous innd statistics [Top 10]:
| Event | Server | Number |
|---|---|---|
| Bad Message-ID's offered | ||
| localhost | 3 | |
| TOTAL: 1 | 3 | |
| Including strange strings | ||
| feed1.usenet.blueworldhosting.com | 184 | |
| TOTAL: 1 | 184 | |
| TOTAL: 2 | 187 | |
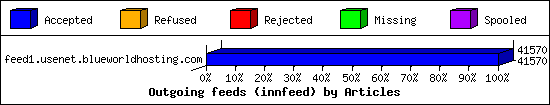
Outgoing Feeds (innfeed) by Articles:
| Server | Offered | Taken | Refused | Reject | Miss | Spool | %Took | Elapsed | |
|---|---|---|---|---|---|---|---|---|---|
| 1 | feed1.usenet.blueworldhosting.com | 41584 | 41570 | 0 | 0 | 0 | 0 | 99% | 06:58:28 |
| TOTAL: 1 | 41584 | 41570 | 0 | 0 | 0 | 0 | 99% | 06:58:28 | |
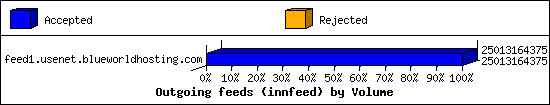
Outgoing Feeds (innfeed) by Volume:
| Server | AcceptVol | RejectVol | TotalVol | Volume/sec | Vol/Art | Elapsed | |
|---|---|---|---|---|---|---|---|
| 1 | feed1.usenet.blueworldhosting.com | 23.3 GB | 0.0 KB | 23.3 GB | 972.9 KB/s | 587.6 KB | 06:58:28 |
| TOTAL: 1 | 23.3 GB | 0.0 KB | 23.3 GB | 972.9 KB/s | 587.6 KB | 06:58:28 | |
NNRP readership statistics:
| System | Conn | Arts | Size | Groups | Post | Rej | Elapsed | |
|---|---|---|---|---|---|---|---|---|
| 1 | 023-084-030-207.res.spectrum.com | 217 | 121 | 34.3 MB | 68 | 27 | 0 | 08:39:03 |
| 2 | 192.168.1.146 | 86 | 0 | 0.0 KB | 0 | 32521 | 0 | 12:38:32 |
| 3 | spool1.usenet.blueworldhosting.com | 6934 | 0 | 0.0 KB | 0 | 6878 | 6 | 00:07:55 |
| TOTAL: 3 | 7237 | 121 | 34.3 MB | 68 | 39426 | 6 | 21:26:09 | |
NNRP readership statistics (by domain):
| System | Conn | Arts | Size | Groups | Post | Rej | Elapsed | |
|---|---|---|---|---|---|---|---|---|
| 1 | *.res.spectrum.com | 217 | 121 | 34.3 MB | 68 | 27 | 0 | 08:39:03 |
| 2 | unresolved | 99 | 0 | 0.0 KB | 0 | 32521 | 0 | 12:39:10 |
| 3 | *.usenet.blueworldhosting.com | 6934 | 0 | 0.0 KB | 0 | 6878 | 6 | 00:07:55 |
| TOTAL: 3 | 7250 | 121 | 34.3 MB | 68 | 39426 | 6 | 21:26:09 | |
NNRP auth users [Top 20]:
| User | Conn |
|---|---|
| jesse | 119 |
| TOTAL: 1 | 119 |
NNRP total resource statistics [Top 20]:
| System | User(ms) | System(ms) | Idle(ms) | Elapsed |
|---|---|---|---|---|
| 192.168.1.146 | 718.326 | 563.243 | 0.992 | 12:38:32 |
| 023-084-030-207.res.spectrum.com | 18.625 | 4.230 | 0.324 | 08:39:03 |
| spool1.usenet.blueworldhosting.com | 382.929 | 83.403 | 0.000 | 00:07:55 |
| 50.83.128.198 | 0.092 | 0.000 | 0.000 | 00:00:31 |
| 208.100.26.244 | 0.832 | 0.102 | 0.000 | 00:00:06 |
| TOTAL: 5 | 1120.804 | 650.978 | 1.316 | 21:26:09 |
Curious NNRP server explorers [Top 20]:
| System | Conn |
|---|---|
| 208.100.26.244 | 12 |
| 50.83.128.198 | 1 |
| TOTAL: 2 | 13 |
NNRP gethostbyaddr failures [Top 20]:
| System | Conn |
|---|---|
| ? (can't getpeername) | 28 |
| TOTAL: 1 | 28 |
NNRP client timeouts [Top 20]:
| System | Conn | Peer |
|---|---|---|
| 023-084-030-207.res.spectrum.com | 47 | 39 |
| 192.168.1.146 | 8 | 8 |
| TOTAL: 2 | 55 | 47 |
Newsgroup request counts (by hierarchy):
| Hierarchy | Count | Pct | |
|---|---|---|---|
| 1 | alt | 94 | 73.4% |
| 2 | news | 22 | 17.2% |
| 3 | comp | 12 | 9.4% |
| TOTAL: 3 | 128 | 100.0% | |
Newsgroup request counts (by newsgroup) [Top 100]:
| Newsgroup | Count | |
|---|---|---|
| 1 | alt.binaries.documentaries | 88 |
| 2 | comp.security.misc | 11 |
| 3 | news.admin.net-abuse.misc | 9 |
| 4 | alt.folklore.computers | 6 |
| 5 | news.groups.questions | 4 |
| 6 | news.announce.conferences | 3 |
| 7 | news.software.nntp | 1 |
| 8 | news.announce.important | 1 |
| 9 | news.groups | 1 |
| 10 | news.software.readers | 1 |
| 11 | news.admin.censorship | 1 |
| 12 | news.admin.hierarchies | 1 |
| 13 | comp.unix.bsd.freebsd.announce | 1 |
| TOTAL: 13 | 128 | |