Log entries by program:
| Program name | Lines | %Lines | Size | %Size |
|---|---|---|---|---|
| inn | 104740 | 82.6% | 11.2 MB | 80.4% |
| innd | 19725 | 15.6% | 2.4 MB | 17.4% |
| nnrpd | 1859 | 1.5% | 262.4 KB | 1.8% |
| innfeed | 420 | 0.3% | 49.6 KB | 0.3% |
| controlchan | 3 | 0.0% | 0.3 KB | 0.0% |
| nocem | 2 | 0.0% | 0.1 KB | 0.0% |
| TOTAL: 6 | 126749 | 100.0% | 13.9 MB | 100.0% |
History cache:
| Reason | Count | %Count |
|---|---|---|
| Do not exist | 104391 | 59.6% |
| Negative hits | 70885 | 40.4% |
| Positive hits | 4 | 0.0% |
| Cache misses | 2 | 0.0% |
| TOTAL: 4 | 175282 | 100.0% |
INND timer:
| Code region | Time | Pct | Invoked | Min(ms) | Avg(ms) | Max(ms) |
|---|---|---|---|---|---|---|
| article cancel | 00:00:00.306 | 0.0% | 64 | 0.000 | 4.781 | 48.000 |
| article cleanup | 00:00:00.635 | 0.0% | 105537 | 0.000 | 0.006 | 0.029 |
| article logging | 00:00:04.094 | 0.0% | 105741 | 0.000 | 0.039 | 2.393 |
| article parse | 00:00:07.137 | 0.0% | 627045 | 0.004 | 0.011 | 0.026 |
| article write | 00:01:41.518 | 0.1% | 87135 | 0.229 | 1.165 | 23.088 |
| artlog/artcncl | 00:00:00.000 | 0.0% | 5 | 0.000 | 0.000 | 0.000 |
| artlog/artparse | 00:00:00.000 | 0.0% | 1 | 0.000 | 0.000 | 0.000 |
| data move | 00:00:01.158 | 0.0% | 751962 | 0.000 | 0.002 | 0.009 |
| hisgrep/artcncl | 00:00:00.098 | 0.0% | 69 | 0.000 | 1.420 | 8.333 |
| hishave/artcncl | 00:00:00.000 | 0.0% | 5 | 0.000 | 0.000 | 0.000 |
| history grep | 00:00:00.000 | 0.0% | 0 | 0.000 | 0.000 | 0.000 |
| history lookup | 00:00:17.465 | 0.0% | 177450 | 0.000 | 0.098 | 2.148 |
| history sync | 00:00:02.745 | 0.0% | 362 | 0.000 | 7.583 | 119.000 |
| history write | 00:02:06.550 | 0.1% | 105537 | 0.294 | 1.199 | 20.092 |
| idle | 23:48:51.467 | 99.2% | 604840 | 12.058 | 141.742 | 3044.234 |
| nntp read | 00:00:09.325 | 0.0% | 632226 | 0.002 | 0.015 | 0.035 |
| overview write | 00:01:31.098 | 0.1% | 87135 | 0.117 | 1.045 | 179.335 |
| perl filter | 00:00:03.356 | 0.0% | 92905 | 0.000 | 0.036 | 0.136 |
| python filter | 00:05:25.291 | 0.4% | 174126 | 0.585 | 1.868 | 20.848 |
| site send | 00:00:03.345 | 0.0% | 88991 | 0.000 | 0.038 | 0.073 |
| TOTAL: 24:00:59.000 | 24:00:25.588 | 100.0% | - | - | - | - |
INNfeed timer:
| Code region | Time | Pct | Invoked | Min(ms) | Avg(ms) | Max(ms) |
|---|---|---|---|---|---|---|
| article new | 00:00:00.002 | 0.0% | 1380 | 0.000 | 0.001 | 0.003 |
| article prepare | 00:00:00.001 | 0.0% | 5520 | 0.000 | 0.000 | 0.000 |
| article read | 00:00:00.177 | 0.0% | 1380 | 0.077 | 0.128 | 47.000 |
| backlog stats | 00:00:00.015 | 0.0% | 53931 | 0.000 | 0.000 | 0.038 |
| callbacks | 00:00:00.000 | 0.0% | 0 | 0.000 | 0.000 | 0.000 |
| data read | 00:00:00.027 | 0.0% | 2926 | 0.000 | 0.009 | 0.011 |
| data write | 00:00:06.594 | 0.0% | 47187 | 0.000 | 0.140 | 0.141 |
| idle | 23:55:25.958 | 100.0% | 53931 | 27.233 | 1596.966 | 24081.160 |
| status file | 00:00:00.023 | 0.0% | 26 | 0.000 | 0.885 | 4.500 |
| TOTAL: 23:55:33.089 | 23:55:32.797 | 100.0% | - | - | - | - |
nnrpd timer:
| Code region | Time | Pct | Invoked | Min(ms) | Avg(ms) | Max(ms) |
|---|---|---|---|---|---|---|
| hisgrep | 00:00:00.113 | 0.0% | 9590 | 0.005 | 0.012 | 0.017 |
| idle | 00:00:00.000 | 0.0% | 0 | 0.000 | 0.000 | 0.000 |
| newnews | 00:00:00.000 | 0.0% | 0 | 0.000 | 0.000 | 0.000 |
| nntpwrite | 00:00:20.184 | 0.1% | 31199 | 0.000 | 0.647 | 242.438 |
| readart | 00:00:00.079 | 0.0% | 15 | 0.000 | 5.267 | 18.000 |
| TOTAL: 10:03:30.479 | 00:00:20.376 | 0.1% | - | - | - | - |
Control commands to INND:
| Command | Number |
|---|---|
| flush | 5 |
| flushlogs | 2 |
| go | 2 |
| logmode | 2 |
| lowmark | 1 |
| mode | 144 |
| name | 2 |
| newgroup | 1 |
| pause | 2 |
| paused | 2 |
| reload | 2 |
| reserve | 2 |
| TOTAL: 12 | 167 |
Newsgroups created:
| Group | Mode |
|---|---|
| free.comp.ipfs | y |
| TOTAL | 1 |
Control Channel:
| Sender | newgroup | rmgroup | Other | Bad PGP | DoIt | OK |
|---|---|---|---|---|---|---|
| fauxdameron@protonmail.com | 1 | 0 | 0 | 0 | 1 | 1 |
| TOTAL | 1 | 0 | 0 | 0 | 1 | 1 |
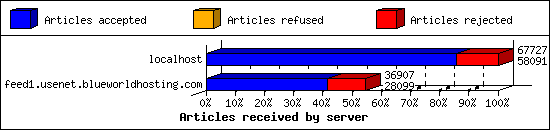
Incoming Feeds (INN):
| Server | Connects | Offered | Taken | Refused | Reject | %Accpt | Elapsed | |
|---|---|---|---|---|---|---|---|---|
| 1 | localhost | 1384 | 67727 | 58091 | 0 | 9636 | 85% | 11:37:23 |
| 2 | feed1.usenet.blueworldhosting.com | 389 | 36907 | 28099 | 0 | 8808 | 76% | 140:18:52 |
| TOTAL: 2 | 1773 | 104634 | 86190 | 0 | 18444 | 82% | 151:56:15 | |
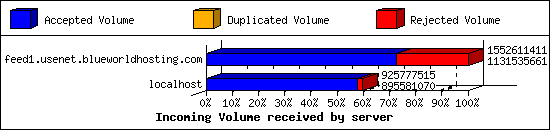
Incoming Volume (INN):
| Server | AcceptVol | DupVol | RejVol | TotalVol | %Acc | Vol/Art | |
|---|---|---|---|---|---|---|---|
| 1 | feed1.usenet.blueworldhosting.com | 1.1 GB | 0.5 KB | 401.6 MB | 1.4 GB | 72% | 41.1 KB |
| 2 | localhost | 854.1 MB | 0.0 KB | 28.8 MB | 882.9 MB | 96% | 13.3 KB |
| TOTAL: 2 | 1.9 GB | 0.5 KB | 430.4 MB | 2.3 GB | 81% | 23.1 KB | |
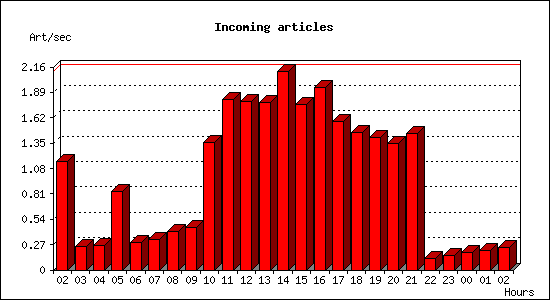
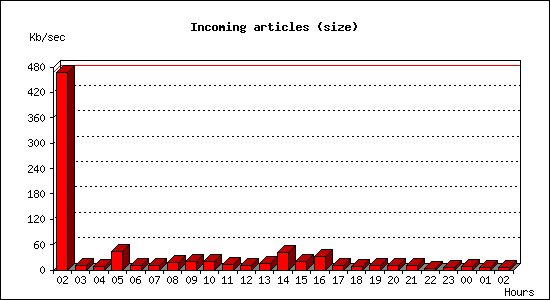
Incoming articles:
| Date | Articles | %Arts | Art/sec | Size | %Size | KB/sec |
|---|---|---|---|---|---|---|
| Jun 12 02:34:00 - 02:59:59 | 1796 | 2.1% | 1.15 | 713.0 MB | 36.8% | 468.02 |
| Jun 12 03:00:00 - 03:59:59 | 916 | 1.1% | 0.25 | 37.5 MB | 1.9% | 10.68 |
| Jun 12 04:00:00 - 04:59:59 | 933 | 1.1% | 0.26 | 25.5 MB | 1.3% | 7.25 |
| Jun 12 05:00:00 - 05:59:59 | 3021 | 3.5% | 0.84 | 157.6 MB | 8.1% | 44.82 |
| Jun 12 06:00:00 - 06:59:59 | 1051 | 1.2% | 0.29 | 36.1 MB | 1.9% | 10.25 |
| Jun 12 07:00:00 - 07:59:59 | 1186 | 1.4% | 0.33 | 40.8 MB | 2.1% | 11.60 |
| Jun 12 08:00:00 - 08:59:59 | 1468 | 1.7% | 0.41 | 59.3 MB | 3.1% | 16.87 |
| Jun 12 09:00:00 - 09:59:59 | 1612 | 1.9% | 0.45 | 72.2 MB | 3.7% | 20.53 |
| Jun 12 10:00:00 - 10:59:59 | 4885 | 5.7% | 1.36 | 70.6 MB | 3.6% | 20.08 |
| Jun 12 11:00:00 - 11:59:59 | 6539 | 7.6% | 1.82 | 49.5 MB | 2.6% | 14.08 |
| Jun 12 12:00:00 - 12:59:59 | 6437 | 7.5% | 1.79 | 39.4 MB | 2.0% | 11.22 |
| Jun 12 13:00:00 - 13:59:59 | 6414 | 7.4% | 1.78 | 52.0 MB | 2.7% | 14.80 |
| Jun 12 14:00:00 - 14:59:59 | 7603 | 8.8% | 2.11 | 143.5 MB | 7.4% | 40.82 |
| Jun 12 15:00:00 - 15:59:59 | 6325 | 7.3% | 1.76 | 67.5 MB | 3.5% | 19.19 |
| Jun 12 16:00:00 - 16:59:59 | 6980 | 8.1% | 1.94 | 108.3 MB | 5.6% | 30.81 |
| Jun 12 17:00:00 - 17:59:59 | 5683 | 6.6% | 1.58 | 35.0 MB | 1.8% | 9.95 |
| Jun 12 18:00:00 - 18:59:59 | 5254 | 6.1% | 1.46 | 32.8 MB | 1.7% | 9.33 |
| Jun 12 19:00:00 - 19:59:59 | 5093 | 5.9% | 1.41 | 34.2 MB | 1.8% | 9.72 |
| Jun 12 20:00:00 - 20:59:59 | 4864 | 5.6% | 1.35 | 37.8 MB | 2.0% | 10.74 |
| Jun 12 21:00:00 - 21:59:59 | 5215 | 6.1% | 1.45 | 33.5 MB | 1.7% | 9.53 |
| Jun 12 22:00:00 - 22:59:59 | 432 | 0.5% | 0.12 | 13.5 MB | 0.7% | 3.84 |
| Jun 12 23:00:00 - 23:59:59 | 569 | 0.7% | 0.16 | 17.4 MB | 0.9% | 4.94 |
| Jun 13 00:00:00 - 00:59:59 | 679 | 0.8% | 0.19 | 26.5 MB | 1.4% | 7.53 |
| Jun 13 01:00:00 - 01:59:59 | 735 | 0.9% | 0.20 | 21.4 MB | 1.1% | 6.10 |
| Jun 13 02:00:00 - 02:34:00 | 498 | 0.6% | 0.24 | 10.6 MB | 0.5% | 5.31 |
| TOTAL: 24:00:00 | 86188 | 100.0% | 1.00 | 1.9 GB | 100.0% | 22.94 |
Sites sending bad articles:
| Server | Total | Group | Dist | Duplic | Unapp | TooOld | Site | Line | Other | |
|---|---|---|---|---|---|---|---|---|---|---|
| 1 | localhost | 9636 | 0 | 9 | 0 | 0 | 0 | 0 | 0 | 9627 |
| 2 | feed1.usenet.blueworldhosting.com | 8911 | 5743 | 0 | 1 | 0 | 0 | 0 | 0 | 3167 |
| TOTAL: 2 | 18547 | 5743 | 9 | 1 | 0 | 0 | 0 | 0 | 12794 | |
Unwanted newsgroups [Top 20]:
| Newsgroup | Count |
|---|---|
| alt.binaries.bloaf | 4520 |
| alt.binaries.ftd | 410 |
| al.binaries.test | 257 |
| talk.ukrainian.tg | 245 |
| talk.english.tg | 59 |
| alt.binaries.pictures.wallpaper | 46 |
| alt.binaries.e-book | 41 |
| talk.generic.ua.ws | 18 |
| finet.binaries.keskustelu | 16 |
| talk.english.tw | 13 |
| wolfsburg.test | 13 |
| alt.binaries.pictures.scenic | 10 |
| alt.binaries.pictures.nude.celebrities.fake | 9 |
| alt.binaries.test.yenc | 8 |
| alt.binaries.pictures.sierra | 5 |
| alt.binaries.e-book.flood | 4 |
| alt.binaries.ebook | 4 |
| alt.binaries.sounds.lossless.jazz | 4 |
| alt.binaries.multimedia.vintage-film.post-1960 | 4 |
| alt.binaries.pictures.rail | 3 |
| TOTAL: 58 | 5743 |
Unwanted distributions [Top 20]:
| Distribution | Count |
|---|---|
| local | 9 |
| TOTAL: 1 | 9 |
INND Python filter [Top 20]:
| Reason | Count |
|---|---|
| EMP PHN Reject | 9507 |
| EMP Body Reject | 420 |
| Bad From (Test User <test-user@nospam.example>) | 288 |
| Bad Subject (MI5 P) | 149 |
| EMP PHL Reject | 135 |
| EMP FSL Reject | 37 |
| Bad Subject (M-IJ-5JVEEULFNACJ7GBFRTK3SU4V2Q4H362X2YHIP) | 20 |
| Bad Subject (MTFOCMY4SZKD3YJRGK6FSBG4RD743CI5O7P) | 20 |
| Bad Subject (MIJZNCD6TZQLQZ6AXSY3UBVGU5P) | 20 |
| Bad Subject (MLHFHHIISHYN5CTFQ4W4337YZG4LFNQT4P) | 20 |
| Bad Subject (MIR6JABEVTLGHGER53AOPP) | 20 |
| Bad Subject (MH-3T-4IXLJ6ZZ3WT45GOKQYN6SJ627GCYFS3URVBYDFANGRP) | 20 |
| Bad Subject (MCZFUJ2D2NIBZQPN3NUG2NH5CLYWXD6SR7FGSC6YYMVJ3P) | 20 |
| Bad Subject (M32RIW56AWJ7R5OGW7DHMYHMYP) | 20 |
| Bad Subject (MVXDFBAUFC2D4M6W2IDRAS6DCNDN5CNKRVP) | 20 |
| Bad Subject (MIA7H3W73OX2O3GFSM33L2P6LKQTMUPP757P) | 20 |
| Bad Subject (MMONJSHPPIAYTIUFDW2CVTA6R5SWW5FT36YUP) | 20 |
| Bad Subject (ML7KDPZGOSLREBIYD4L25DT4IG5IZAMDNQ2P) | 20 |
| Bad Subject (M3-KMJ6ADFQMLSXIHP6YZC6VQFBTQSW2JG5OUGI3LGCP) | 20 |
| Bad Subject (M6TDPFI3C5P) | 20 |
| TOTAL: 121 | 12591 |
Miscellaneous innd statistics [Top 10]:
| Event | Server | Number |
|---|---|---|
| Including strange strings | ||
| feed1.usenet.blueworldhosting.com | 202 | |
| TOTAL: 1 | 202 | |
| TOTAL: 1 | 202 | |
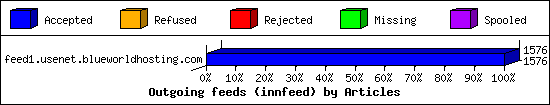
Outgoing Feeds (innfeed) by Articles:
| Server | Offered | Taken | Refused | Reject | Miss | Spool | %Took | Elapsed | |
|---|---|---|---|---|---|---|---|---|---|
| 1 | feed1.usenet.blueworldhosting.com | 1576 | 1576 | 0 | 0 | 0 | 0 | 100% | 00:56:17 |
| TOTAL: 1 | 1576 | 1576 | 0 | 0 | 0 | 0 | 100% | 00:56:17 | |
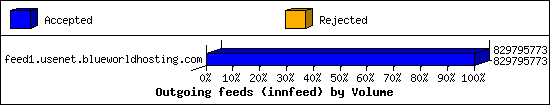
Outgoing Feeds (innfeed) by Volume:
| Server | AcceptVol | RejectVol | TotalVol | Volume/sec | Vol/Art | Elapsed | |
|---|---|---|---|---|---|---|---|
| 1 | feed1.usenet.blueworldhosting.com | 791.4 MB | 0.0 KB | 791.4 MB | 240.0 KB/s | 514.2 KB | 00:56:17 |
| TOTAL: 1 | 791.4 MB | 0.0 KB | 791.4 MB | 240.0 KB/s | 514.2 KB | 00:56:17 | |
NNRP readership statistics:
| System | Conn | Arts | Size | Groups | Post | Rej | Elapsed | |
|---|---|---|---|---|---|---|---|---|
| 1 | 023-084-030-207.res.spectrum.com | 17 | 15 | 402.4 KB | 15 | 1 | 0 | 06:37:37 |
| 2 | 192.168.1.146 | 3 | 0 | 0.0 KB | 0 | 3719 | 0 | 03:07:06 |
| TOTAL: 2 | 20 | 15 | 402.4 KB | 15 | 3720 | 0 | 10:03:30 | |
NNRP readership statistics (by domain):
| System | Conn | Arts | Size | Groups | Post | Rej | Elapsed | |
|---|---|---|---|---|---|---|---|---|
| 1 | *.res.spectrum.com | 17 | 15 | 402.4 KB | 15 | 1 | 0 | 06:37:37 |
| 2 | unresolved | 6 | 0 | 0.0 KB | 0 | 3719 | 0 | 03:07:32 |
| 3 | *.hsd1.fl.comcast.net | 29 | 0 | 0.0 KB | 0 | 0 | 0 | 00:18:20 |
| TOTAL: 3 | 52 | 15 | 402.4 KB | 15 | 3720 | 0 | 10:03:30 | |
NNRP auth users [Top 20]:
| User | Conn |
|---|---|
| jesse | 19 |
| TOTAL: 1 | 19 |
NNRP total resource statistics [Top 20]:
| System | User(ms) | System(ms) | Idle(ms) | Elapsed |
|---|---|---|---|---|
| 023-084-030-207.res.spectrum.com | 2.545 | 1.667 | 0.089 | 06:37:37 |
| 192.168.1.146 | 53.758 | 43.497 | 0.262 | 03:07:06 |
| c-98-224-35-5.hsd1.fl.comcast.net | 2.605 | 0.770 | 0.000 | 00:18:20 |
| 50.83.128.198 | 0.106 | 0.050 | 0.000 | 00:00:23 |
| 141.105.66.247 | 0.082 | 0.000 | 0.000 | 00:00:01 |
| 104.156.155.24 | 0.061 | 0.035 | 0.000 | 00:00:01 |
| TOTAL: 6 | 59.157 | 46.019 | 0.351 | 10:03:30 |
Curious NNRP server explorers [Top 20]:
| System | Conn |
|---|---|
| c-98-224-35-5.hsd1.fl.comcast.net | 29 |
| 141.105.66.247 | 1 |
| 50.83.128.198 | 1 |
| 104.156.155.24 | 1 |
| TOTAL: 4 | 32 |
NNRP client timeouts [Top 20]:
| System | Conn | Peer |
|---|---|---|
| 023-084-030-207.res.spectrum.com | 16 | 6 |
| TOTAL: 1 | 16 | 6 |
Newsgroup request counts (by hierarchy):
| Hierarchy | Count | Pct | |
|---|---|---|---|
| 1 | alt | 9 | 60.0% |
| 2 | news | 6 | 40.0% |
| TOTAL: 2 | 15 | 100.0% | |
Newsgroup request counts (by newsgroup) [Top 100]:
| Newsgroup | Count | |
|---|---|---|
| 1 | alt.folklore.computers | 8 |
| 2 | news.software.nntp | 4 |
| 3 | news.answers | 1 |
| 4 | news.groups | 1 |
| 5 | alt.binaries.documentaries | 1 |
| TOTAL: 5 | 15 | |