Log entries by program:
| Program name | Lines | %Lines | Size | %Size |
|---|---|---|---|---|
| inn | 164260 | 68.5% | 16.1 MB | 64.0% |
| innd | 60235 | 25.1% | 7.0 MB | 27.6% |
| nnrpd | 14914 | 6.2% | 2.1 MB | 8.3% |
| innfeed | 237 | 0.1% | 30.6 KB | 0.1% |
| nocem | 4 | 0.0% | 0.4 KB | 0.0% |
| controlchan | 4 | 0.0% | 0.3 KB | 0.0% |
| TOTAL: 6 | 239654 | 100.0% | 25.1 MB | 100.0% |
History cache:
| Reason | Count | %Count |
|---|---|---|
| Do not exist | 163441 | 54.8% |
| Negative hits | 134216 | 45.0% |
| Positive hits | 426 | 0.1% |
| Cache misses | 27 | 0.0% |
| TOTAL: 4 | 298110 | 100.0% |
INND timer:
| Code region | Time | Pct | Invoked | Min(ms) | Avg(ms) | Max(ms) |
|---|---|---|---|---|---|---|
| article cancel | 00:00:00.395 | 0.0% | 89 | 0.000 | 4.438 | 23.667 |
| article cleanup | 00:00:01.025 | 0.0% | 163527 | 0.000 | 0.006 | 0.030 |
| article logging | 00:00:05.083 | 0.0% | 163700 | 0.016 | 0.031 | 0.134 |
| article parse | 00:00:09.680 | 0.0% | 861128 | 0.005 | 0.011 | 0.020 |
| article write | 00:02:12.297 | 0.2% | 140027 | 0.300 | 0.945 | 24.064 |
| artlog/artcncl | 00:00:00.001 | 0.0% | 14 | 0.000 | 0.071 | 0.500 |
| artlog/artparse | 00:00:00.000 | 0.0% | 42 | 0.000 | 0.000 | 0.000 |
| data move | 00:00:01.407 | 0.0% | 967610 | 0.000 | 0.001 | 0.005 |
| hisgrep/artcncl | 00:00:00.217 | 0.0% | 101 | 0.000 | 2.149 | 16.667 |
| hishave/artcncl | 00:00:00.000 | 0.0% | 14 | 0.000 | 0.000 | 0.000 |
| history grep | 00:00:00.000 | 0.0% | 0 | 0.000 | 0.000 | 0.000 |
| history lookup | 00:00:08.206 | 0.0% | 298234 | 0.001 | 0.028 | 6.619 |
| history sync | 00:00:01.526 | 0.0% | 323 | 0.000 | 4.724 | 52.333 |
| history write | 00:02:21.883 | 0.2% | 163568 | 0.299 | 0.867 | 11.922 |
| idle | 23:47:02.549 | 99.1% | 865633 | 4.964 | 98.913 | 2795.075 |
| nntp read | 00:00:12.401 | 0.0% | 878658 | 0.004 | 0.014 | 0.038 |
| overview write | 00:01:05.524 | 0.1% | 140027 | 0.114 | 0.468 | 30.515 |
| perl filter | 00:00:05.379 | 0.0% | 144998 | 0.013 | 0.037 | 0.169 |
| python filter | 00:06:23.913 | 0.4% | 294327 | 0.634 | 1.304 | 39.700 |
| site send | 00:00:05.641 | 0.0% | 152986 | 0.000 | 0.037 | 0.061 |
| TOTAL: 24:00:41.370 | 23:59:57.127 | 99.9% | - | - | - | - |
INNfeed timer:
| Code region | Time | Pct | Invoked | Min(ms) | Avg(ms) | Max(ms) |
|---|---|---|---|---|---|---|
| article new | 00:00:00.028 | 0.0% | 12876 | 0.001 | 0.002 | 0.002 |
| article prepare | 00:00:00.020 | 0.0% | 51504 | 0.000 | 0.000 | 0.000 |
| article read | 00:00:01.012 | 0.0% | 12876 | 0.073 | 0.079 | 0.110 |
| backlog stats | 00:00:00.029 | 0.0% | 112382 | 0.000 | 0.000 | 0.038 |
| callbacks | 00:00:00.000 | 0.0% | 0 | 0.000 | 0.000 | 0.000 |
| data read | 00:00:00.327 | 0.0% | 25935 | 0.000 | 0.013 | 0.017 |
| data write | 00:00:11.599 | 0.0% | 83557 | 0.000 | 0.139 | 0.500 |
| idle | 23:45:21.821 | 100.0% | 112382 | 10.068 | 760.992 | 24076.000 |
| status file | 00:00:00.009 | 0.0% | 28 | 0.000 | 0.321 | 1.000 |
| TOTAL: 23:45:35.798 | 23:45:34.845 | 100.0% | - | - | - | - |
nnrpd timer:
| Code region | Time | Pct | Invoked | Min(ms) | Avg(ms) | Max(ms) |
|---|---|---|---|---|---|---|
| hisgrep | 00:00:00.195 | 0.0% | 542 | 0.000 | 0.360 | 0.477 |
| idle | 00:00:00.000 | 0.0% | 0 | 0.000 | 0.000 | 0.000 |
| newnews | 00:00:00.000 | 0.0% | 0 | 0.000 | 0.000 | 0.000 |
| nntpwrite | 00:00:38.964 | 0.1% | 42482 | 0.000 | 0.917 | 492.756 |
| readart | 00:00:00.573 | 0.0% | 109 | 1.333 | 5.257 | 36.000 |
| TOTAL: 11:16:08.806 | 00:00:39.732 | 0.1% | - | - | - | - |
Control commands to INND:
| Command | Number |
|---|---|
| flush | 5 |
| flushlogs | 2 |
| go | 2 |
| logmode | 2 |
| lowmark | 1 |
| mode | 148 |
| name | 2 |
| pause | 2 |
| paused | 2 |
| reload | 2 |
| reserve | 2 |
| rmgroup | 1 |
| TOTAL: 12 | 171 |
Newsgroups removed:
| Group |
|---|
| de.etc.bahn.announce |
| TOTAL: 1 |
Control Channel:
| Sender | newgroup | rmgroup | Other | Bad PGP | DoIt | OK |
|---|---|---|---|---|---|---|
| moderator@dana.de | 0 | 1 | 0 | 1 | 1 | 1 |
| TOTAL | 0 | 1 | 0 | 1 | 1 | 1 |
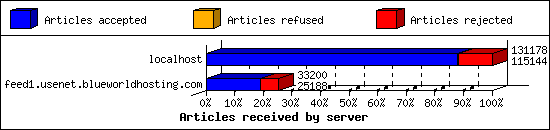
Incoming Feeds (INN):
| Server | Connects | Offered | Taken | Refused | Reject | %Accpt | Elapsed | |
|---|---|---|---|---|---|---|---|---|
| 1 | localhost | 12880 | 131178 | 115144 | 479 | 15555 | 87% | 18:55:04 |
| 2 | feed1.usenet.blueworldhosting.com | 324 | 33200 | 25188 | 0 | 8012 | 75% | 110:20:49 |
| TOTAL: 2 | 13204 | 164378 | 140332 | 479 | 23567 | 85% | 129:15:53 | |
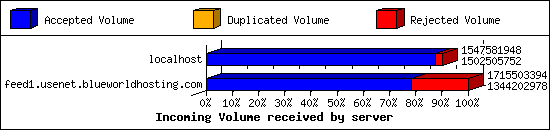
Incoming Volume (INN):
| Server | AcceptVol | DupVol | RejVol | TotalVol | %Acc | Vol/Art | |
|---|---|---|---|---|---|---|---|
| 1 | localhost | 1.4 GB | 0.0 KB | 43.0 MB | 1.4 GB | 97% | 11.6 KB |
| 2 | feed1.usenet.blueworldhosting.com | 1.3 GB | 0.0 KB | 354.1 MB | 1.6 GB | 78% | 50.5 KB |
| TOTAL: 2 | 2.7 GB | 0.0 KB | 397.1 MB | 3.0 GB | 87% | 19.4 KB | |
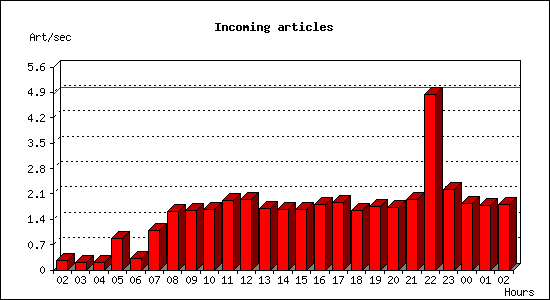
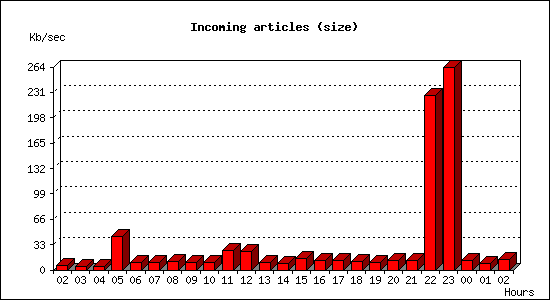
Incoming articles:
| Date | Articles | %Arts | Art/sec | Size | %Size | KB/sec |
|---|---|---|---|---|---|---|
| Jun 13 02:34:00 - 02:59:59 | 393 | 0.3% | 0.25 | 9.9 MB | 0.4% | 6.49 |
| Jun 13 03:00:00 - 03:59:59 | 785 | 0.6% | 0.22 | 15.4 MB | 0.6% | 4.39 |
| Jun 13 04:00:00 - 04:59:59 | 740 | 0.5% | 0.21 | 14.7 MB | 0.5% | 4.19 |
| Jun 13 05:00:00 - 05:59:59 | 3122 | 2.2% | 0.87 | 152.4 MB | 5.6% | 43.34 |
| Jun 13 06:00:00 - 06:59:59 | 1129 | 0.8% | 0.31 | 33.1 MB | 1.2% | 9.41 |
| Jun 13 07:00:00 - 07:59:59 | 3939 | 2.8% | 1.09 | 32.4 MB | 1.2% | 9.23 |
| Jun 13 08:00:00 - 08:59:59 | 5817 | 4.1% | 1.62 | 38.1 MB | 1.4% | 10.83 |
| Jun 13 09:00:00 - 09:59:59 | 5904 | 4.2% | 1.64 | 34.2 MB | 1.3% | 9.72 |
| Jun 13 10:00:00 - 10:59:59 | 5997 | 4.3% | 1.67 | 33.4 MB | 1.2% | 9.49 |
| Jun 13 11:00:00 - 11:59:59 | 6890 | 4.9% | 1.91 | 90.8 MB | 3.3% | 25.82 |
| Jun 13 12:00:00 - 12:59:59 | 6956 | 5.0% | 1.93 | 86.6 MB | 3.2% | 24.63 |
| Jun 13 13:00:00 - 13:59:59 | 6123 | 4.4% | 1.70 | 32.2 MB | 1.2% | 9.15 |
| Jun 13 14:00:00 - 14:59:59 | 5993 | 4.3% | 1.66 | 29.7 MB | 1.1% | 8.46 |
| Jun 13 15:00:00 - 15:59:59 | 6034 | 4.3% | 1.68 | 52.0 MB | 1.9% | 14.80 |
| Jun 13 16:00:00 - 16:59:59 | 6498 | 4.6% | 1.80 | 41.2 MB | 1.5% | 11.72 |
| Jun 13 17:00:00 - 17:59:59 | 6654 | 4.7% | 1.85 | 41.4 MB | 1.5% | 11.78 |
| Jun 13 18:00:00 - 18:59:59 | 5914 | 4.2% | 1.64 | 38.2 MB | 1.4% | 10.88 |
| Jun 13 19:00:00 - 19:59:59 | 6259 | 4.5% | 1.74 | 34.0 MB | 1.3% | 9.66 |
| Jun 13 20:00:00 - 20:59:59 | 6238 | 4.4% | 1.73 | 42.7 MB | 1.6% | 12.16 |
| Jun 13 21:00:00 - 21:59:59 | 6987 | 5.0% | 1.94 | 43.6 MB | 1.6% | 12.42 |
| Jun 13 22:00:00 - 22:59:59 | 17414 | 12.4% | 4.84 | 796.5 MB | 29.3% | 226.56 |
| Jun 13 23:00:00 - 23:59:59 | 7950 | 5.7% | 2.21 | 926.8 MB | 34.1% | 263.63 |
| Jun 14 00:00:00 - 00:59:59 | 6639 | 4.7% | 1.84 | 42.3 MB | 1.6% | 12.04 |
| Jun 14 01:00:00 - 01:59:59 | 6359 | 4.5% | 1.77 | 28.2 MB | 1.0% | 8.01 |
| Jun 14 02:00:00 - 02:34:00 | 3700 | 2.6% | 1.81 | 27.3 MB | 1.0% | 13.72 |
| TOTAL: 24:00:00 | 140434 | 100.0% | 1.63 | 2.7 GB | 100.0% | 32.20 |
Sites sending bad articles:
| Server | Total | Group | Dist | Duplic | Unapp | TooOld | Site | Line | Other | |
|---|---|---|---|---|---|---|---|---|---|---|
| 1 | localhost | 15599 | 0 | 10 | 0 | 0 | 0 | 0 | 0 | 15589 |
| 2 | feed1.usenet.blueworldhosting.com | 8213 | 4995 | 0 | 0 | 1 | 0 | 0 | 0 | 3217 |
| TOTAL: 2 | 23812 | 4995 | 10 | 0 | 1 | 0 | 0 | 0 | 18806 | |
Unwanted newsgroups [Top 20]:
| Newsgroup | Count |
|---|---|
| alt.binaries.bloaf | 3819 |
| alt.binaries.ftd | 372 |
| al.binaries.test | 265 |
| talk.ukrainian.tg | 230 |
| talk.english.tg | 44 |
| talk.generic.ua.ws | 26 |
| finet.binaries.keskustelu | 24 |
| talk.english.tw | 19 |
| alt.binaries.e-book | 19 |
| alt.binaries.boneless | 15 |
| alt.binaries.pictures.scenic | 10 |
| alt.binaries.pictures.teen-starlets | 10 |
| alt.binaries.pictures.nude.celebrities.fake | 9 |
| wolfsburg.test | 8 |
| alt.binaries.e-book.rpg | 8 |
| alt.binaries.test.yenc | 8 |
| alt.binaries.pictures.earlmiller | 6 |
| alt.binaries.pictures.sierra | 5 |
| intel.motherboards.pentium_ii | 5 |
| alt.binaries.ebook | 4 |
| TOTAL: 74 | 4995 |
Unwanted distributions [Top 20]:
| Distribution | Count |
|---|---|
| local | 10 |
| TOTAL: 1 | 10 |
Supposedly-moderated groups with unmoderated postings [Top 20]:
| Groups | Count |
|---|---|
| bit.listserv.catholic | 1 |
| TOTAL: 1 | 1 |
INND Python filter [Top 20]:
| Reason | Count |
|---|---|
| EMP PHN Reject | 15517 |
| EMP Body Reject | 945 |
| Bad From (Test User <test-user@nospam.example>) | 288 |
| EMP PHL Reject | 203 |
| EMP FSL Reject | 88 |
| Snipe Forge | 37 |
| Bad Subject (MS7RW7SHU2Q7QGLNNQITF5QRSTP) | 20 |
| Bad Subject (MYFQLINRQFAUDGXFUR7NTA2LYYMY3CAHYRQNG2645SP) | 20 |
| Bad Subject (MX5IS65AUS72XRGWGZ2J2P) | 20 |
| Bad Subject (M35XULYWBONG4TXNW2ILUUD2ANXSN5LHEL5MP) | 20 |
| Bad Subject (MBJ5D7FKVNUIH3VM5BMQIMAKXDP) | 20 |
| Bad Subject (M-25-KV3QBOWZMROWH46X3TITG5UVCGQH5BEOBBSTACXZGP) | 20 |
| Bad Subject (M-AI-EFQJUDIJSCH5AAT7NMPKUIRSXD7WY4WBP) | 20 |
| Bad Subject (MZEPFIKO2GHO5TWB65I2BPJP5MR3P) | 20 |
| Bad Subject (M-TD-4MI57LKQJY77TZB5Y5756AXNMJV5P2UCTPQNNKUX5P) | 20 |
| Bad Subject (MARN33VC5AZAGI5AAJVTX32P) | 20 |
| Bad Subject (MINRXXJEH2XBEYIH2KLNI5WYH42VRT52EOP) | 20 |
| Bad Subject (MCEJ54ODHLNQICXM7EE6W4FTLPSSE54DARJ3CKOBBP) | 20 |
| Bad Subject (M-RG-DALAAG43NHOILIK7ZZ7SWGNSTZEWNX5WHFCP) | 20 |
| Bad Subject (M3FHJ6VBBUFW35FIADLLMUXKAU25CWL62DH2P) | 20 |
| TOTAL: 121 | 18590 |
NoCeM on Spool:
| Id | Good | Bad | Unique | Total |
|---|---|---|---|---|
| bleachbot@httrack.com | 2 | 0 | 2 | 2 |
| nocem@novabbs.com | 0 | 1 | 0 | 0 |
| TOTAL: 2 | 2 | 1 | 2 | 2 |
Miscellaneous innd statistics [Top 10]:
| Event | Server | Number |
|---|---|---|
| Bad Message-ID's offered | ||
| localhost | 21 | |
| TOTAL: 1 | 21 | |
| Including strange strings | ||
| feed1.usenet.blueworldhosting.com | 156 | |
| localhost | 17 | |
| TOTAL: 2 | 173 | |
| No colon-space in header field | ||
| localhost | 40 | |
| TOTAL: 1 | 40 | |
| TOTAL: 3 | 234 | |
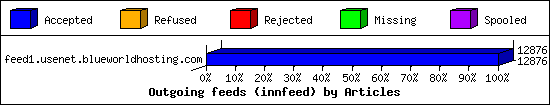
Outgoing Feeds (innfeed) by Articles:
| Server | Offered | Taken | Refused | Reject | Miss | Spool | %Took | Elapsed | |
|---|---|---|---|---|---|---|---|---|---|
| 1 | feed1.usenet.blueworldhosting.com | 12876 | 12876 | 0 | 0 | 0 | 0 | 100% | 00:45:23 |
| TOTAL: 1 | 12876 | 12876 | 0 | 0 | 0 | 0 | 100% | 00:45:23 | |
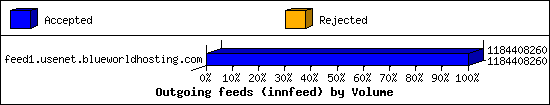
Outgoing Feeds (innfeed) by Volume:
| Server | AcceptVol | RejectVol | TotalVol | Volume/sec | Vol/Art | Elapsed | |
|---|---|---|---|---|---|---|---|
| 1 | feed1.usenet.blueworldhosting.com | 1.1 GB | 0.0 KB | 1.1 GB | 424.8 KB/s | 89.8 KB | 00:45:23 |
| TOTAL: 1 | 1.1 GB | 0.0 KB | 1.1 GB | 424.8 KB/s | 89.8 KB | 00:45:23 | |
NNRP readership statistics:
| System | Conn | Arts | Size | Groups | Post | Rej | Elapsed | |
|---|---|---|---|---|---|---|---|---|
| 1 | 023-084-030-207.res.spectrum.com | 35 | 109 | 263.6 KB | 118 | 0 | 0 | 08:49:49 |
| 2 | 192.168.1.146 | 120 | 0 | 0.0 KB | 0 | 12876 | 0 | 02:25:03 |
| TOTAL: 2 | 155 | 109 | 263.6 KB | 118 | 12876 | 0 | 11:16:07 | |
NNRP readership statistics (by domain):
| System | Conn | Arts | Size | Groups | Post | Rej | Elapsed | |
|---|---|---|---|---|---|---|---|---|
| 1 | *.res.spectrum.com | 35 | 109 | 263.6 KB | 118 | 0 | 0 | 08:49:49 |
| 2 | unresolved | 128 | 0 | 0.0 KB | 0 | 12876 | 0 | 02:26:17 |
| TOTAL: 2 | 163 | 109 | 263.6 KB | 118 | 12876 | 0 | 11:16:07 | |
NNRP auth users [Top 20]:
| User | Conn |
|---|---|
| jesse | 155 |
| TOTAL: 1 | 155 |
NNRP total resource statistics [Top 20]:
| System | User(ms) | System(ms) | Idle(ms) | Elapsed |
|---|---|---|---|---|
| 023-084-030-207.res.spectrum.com | 5.028 | 3.261 | 0.186 | 08:49:49 |
| 192.168.1.146 | 50.270 | 31.764 | 0.530 | 02:25:03 |
| 185.107.95.85 | 0.544 | 0.168 | 0.000 | 00:01:06 |
| 50.83.128.198 | 0.132 | 0.017 | 0.000 | 00:00:07 |
| TOTAL: 4 | 55.974 | 35.210 | 0.716 | 11:16:07 |
Curious NNRP server explorers [Top 20]:
| System | Conn |
|---|---|
| 185.107.95.85 | 7 |
| 50.83.128.198 | 1 |
| TOTAL: 2 | 8 |
NNRP client timeouts [Top 20]:
| System | Conn | Peer |
|---|---|---|
| 192.168.1.146 | 120 | 120 |
| 023-084-030-207.res.spectrum.com | 26 | 19 |
| TOTAL: 2 | 146 | 139 |
Newsgroup request counts (by hierarchy):
| Hierarchy | Count | Pct | |
|---|---|---|---|
| 1 | news | 65 | 52.4% |
| 2 | comp | 57 | 46.0% |
| 3 | alt | 2 | 1.6% |
| TOTAL: 3 | 124 | 100.0% | |
Newsgroup request counts (by newsgroup) [Top 100]:
| Newsgroup | Count | |
|---|---|---|
| 1 | news.groups | 61 |
| 2 | comp.unix.shell | 46 |
| 3 | comp.unix.aix | 4 |
| 4 | alt.test | 2 |
| 5 | comp.unix.programmer | 2 |
| 6 | comp.unix.tru64 | 2 |
| 7 | comp.unix.internals | 2 |
| 8 | news.admin.technical | 1 |
| 9 | news.answers | 1 |
| 10 | comp.unix.misc | 1 |
| 11 | news.admin.peering | 1 |
| 12 | news.software.nntp | 1 |
| TOTAL: 12 | 124 | |