Log entries by program:
| Program name | Lines | %Lines | Size | %Size |
|---|---|---|---|---|
| inn | 15198 | 57.5% | 1.8 MB | 63.7% |
| nnrpd | 9827 | 37.2% | 910.5 KB | 31.2% |
| innd | 1321 | 5.0% | 138.3 KB | 4.7% |
| innfeed | 96 | 0.4% | 11.6 KB | 0.4% |
| nocem | 5 | 0.0% | 0.4 KB | 0.0% |
| controlchan | 5 | 0.0% | 0.2 KB | 0.0% |
| TOTAL: 6 | 26452 | 100.0% | 2.9 MB | 100.0% |
History cache:
| Reason | Count | %Count |
|---|---|---|
| Do not exist | 14857 | 77.4% |
| Negative hits | 4343 | 22.6% |
| Positive hits | 1 | 0.0% |
| Cache misses | 0 | 0.0% |
| TOTAL: 4 | 19201 | 100.0% |
INND timer:
| Code region | Time | Pct | Invoked | Min(ms) | Avg(ms) | Max(ms) |
|---|---|---|---|---|---|---|
| article cancel | 00:00:00.569 | 0.0% | 17 | 22.667 | 33.471 | 72.000 |
| article cleanup | 00:00:00.151 | 0.0% | 15135 | 0.005 | 0.010 | 0.022 |
| article logging | 00:00:01.637 | 0.0% | 15147 | 0.027 | 0.108 | 0.938 |
| article parse | 00:00:09.023 | 0.1% | 501479 | 0.011 | 0.018 | 0.025 |
| article write | 00:11:12.467 | 5.9% | 13591 | 0.565 | 49.479 | 132.655 |
| artlog/artcncl | 00:00:00.000 | 0.0% | 1 | 0.000 | 0.000 | 0.000 |
| data move | 00:00:01.409 | 0.0% | 588085 | 0.001 | 0.002 | 0.004 |
| hisgrep/artcncl | 00:00:00.385 | 0.0% | 18 | 6.000 | 21.389 | 27.667 |
| hishave/artcncl | 00:00:00.000 | 0.0% | 1 | 0.000 | 0.000 | 0.000 |
| history grep | 00:00:00.000 | 0.0% | 0 | 0.000 | 0.000 | 0.000 |
| history lookup | 00:02:06.543 | 1.1% | 19756 | 2.794 | 6.405 | 10.291 |
| history sync | 00:00:07.479 | 0.1% | 49 | 0.000 | 152.633 | 472.500 |
| history write | 00:11:29.322 | 6.0% | 13591 | 32.636 | 50.719 | 78.492 |
| idle | 02:40:05.173 | 84.2% | 433180 | 5.029 | 22.174 | 232.569 |
| nntp read | 00:00:18.860 | 0.2% | 501609 | 0.025 | 0.038 | 0.049 |
| overview write | 00:01:23.889 | 0.7% | 13591 | 2.368 | 6.172 | 35.893 |
| perl filter | 00:00:01.304 | 0.0% | 14037 | 0.038 | 0.093 | 0.118 |
| python filter | 00:02:48.908 | 1.5% | 15135 | 2.746 | 11.160 | 16.061 |
| site send | 00:00:00.321 | 0.0% | 13601 | 0.000 | 0.024 | 0.061 |
| TOTAL: 03:10:10.033 | 03:09:47.440 | 99.8% | - | - | - | - |
INNfeed timer:
| Code region | Time | Pct | Invoked | Min(ms) | Avg(ms) | Max(ms) |
|---|---|---|---|---|---|---|
| article new | 00:00:00.000 | 0.0% | 0 | 0.000 | 0.000 | 0.000 |
| article prepare | 00:00:00.000 | 0.0% | 0 | 0.000 | 0.000 | 0.000 |
| article read | 00:00:00.000 | 0.0% | 0 | 0.000 | 0.000 | 0.000 |
| backlog stats | 00:00:00.000 | 0.0% | 521 | 0.000 | 0.000 | 0.000 |
| callbacks | 00:00:00.000 | 0.0% | 0 | 0.000 | 0.000 | 0.000 |
| data read | 00:00:00.000 | 0.0% | 6 | 0.000 | 0.000 | 0.000 |
| data write | 00:00:00.000 | 0.0% | 6 | 0.000 | 0.000 | 0.000 |
| idle | 03:11:40.853 | 100.0% | 521 | 17148.771 | 22074.574 | 23322.667 |
| status file | 00:00:00.006 | 0.0% | 12 | 0.000 | 0.500 | 1.250 |
| TOTAL: 03:11:40.886 | 03:11:40.859 | 100.0% | - | - | - | - |
nnrpd timer:
| Code region | Time | Pct | Invoked | Min(ms) | Avg(ms) | Max(ms) |
|---|---|---|---|---|---|---|
| hisgrep | 00:00:00.120 | 0.0% | 8 | 0.000 | 15.000 | 53.000 |
| idle | 00:00:00.000 | 0.0% | 0 | 0.000 | 0.000 | 0.000 |
| newnews | 00:00:00.000 | 0.0% | 0 | 0.000 | 0.000 | 0.000 |
| nntpwrite | 00:03:58.296 | 1.7% | 1741674 | 0.000 | 0.137 | 1.804 |
| readart | 00:00:00.159 | 0.0% | 8 | 8.500 | 19.875 | 49.000 |
| TOTAL: 03:58:46.579 | 00:03:58.575 | 1.7% | - | - | - | - |
Control commands to INND:
| Command | Number |
|---|---|
| flush | 4 |
| flushlogs | 2 |
| go | 1 |
| logmode | 2 |
| mode | 20 |
| name | 1 |
| newgroup | 4 |
| pause | 2 |
| paused | 1 |
| reload | 6 |
| reserve | 1 |
| shutdown | 3 |
| TOTAL: 12 | 47 |
Newsgroups created:
| Group | Mode |
|---|---|
| alt.b | y |
| alt.binaries.backup | y |
| alt.binaries.bloaf | y |
| alt.binaries.ftd | y |
| TOTAL | 4 |
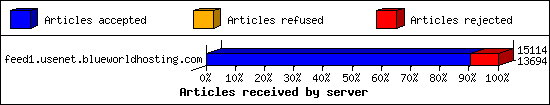
Incoming Feeds (INN):
| Server | Connects | Offered | Taken | Refused | Reject | %Accpt | Elapsed | |
|---|---|---|---|---|---|---|---|---|
| 1 | feed1.usenet.blueworldhosting.com | 38 | 15114 | 13694 | 0 | 1420 | 90% | 12:38:50 |
| TOTAL: 1 | 38 | 15114 | 13694 | 0 | 1420 | 90% | 12:38:50 | |
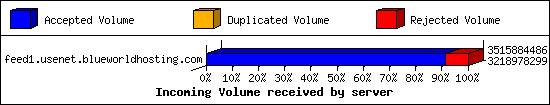
Incoming Volume (INN):
| Server | AcceptVol | DupVol | RejVol | TotalVol | %Acc | Vol/Art | |
|---|---|---|---|---|---|---|---|
| 1 | feed1.usenet.blueworldhosting.com | 3.0 GB | 0.0 KB | 283.2 MB | 3.3 GB | 91% | 227.2 KB |
| TOTAL: 1 | 3.0 GB | 0.0 KB | 283.2 MB | 3.3 GB | 91% | 227.2 KB | |
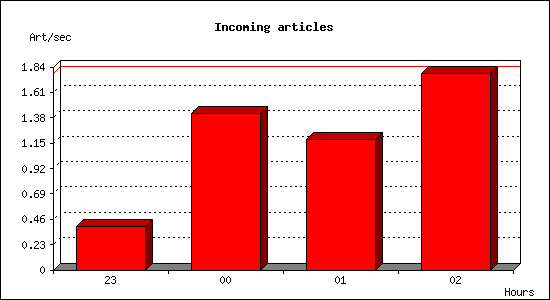
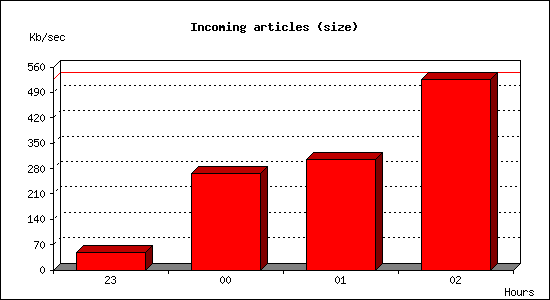
Incoming articles:
| Date | Articles | %Arts | Art/sec | Size | %Size | KB/sec |
|---|---|---|---|---|---|---|
| Jun 29 23:09:11 - 23:59:59 | 1201 | 8.7% | 0.39 | 146.5 MB | 4.8% | 49.20 |
| Jun 30 00:00:00 - 00:59:59 | 5113 | 37.2% | 1.42 | 933.0 MB | 30.3% | 265.39 |
| Jun 30 01:00:00 - 01:59:59 | 4242 | 30.8% | 1.18 | 1.0 GB | 34.9% | 305.21 |
| Jun 30 02:00:00 - 02:30:00 | 3207 | 23.3% | 1.78 | 925.7 MB | 30.1% | 526.65 |
| TOTAL: 03:20:49 | 13763 | 100.0% | 1.14 | 3.0 GB | 100.0% | 261.61 |
Sites sending bad articles:
| Server | Total | Group | Dist | Duplic | Unapp | TooOld | Site | Line | Other | |
|---|---|---|---|---|---|---|---|---|---|---|
| 1 | feed1.usenet.blueworldhosting.com | 1434 | 565 | 0 | 0 | 1 | 0 | 0 | 0 | 868 |
| TOTAL: 1 | 1434 | 565 | 0 | 0 | 1 | 0 | 0 | 0 | 868 | |
Unwanted newsgroups [Top 20]:
| Newsgroup | Count |
|---|---|
| alt.binaries.bloaf | 360 |
| talk.ukrainian.tg | 63 |
| alt.binaries.ftd | 58 |
| al.binaries.test | 53 |
| talk.english.tg | 8 |
| alt.binaries.pictures.teen-starlets | 6 |
| talk.generic.ua.ws | 4 |
| alt.binaries.howard-stern | 2 |
| finet.binaries.keskustelu | 1 |
| alt.binaries.multimedia.vintage-film.post-1960 | 1 |
| alt.fan.rush- | 1 |
| alt.binaries.pictures.e | 1 |
| alt.binaries.pictures.poultry | 1 |
| alt.binaries.ebook | 1 |
| intel.motherboards.pentium_ii | 1 |
| talk.english.tw | 1 |
| eternal-september.moderated | 1 |
| alt.binaries.test.yenc | 1 |
| alt.binaries.multimedia.vintage-film | 1 |
| TOTAL: 19 | 565 |
Supposedly-moderated groups with unmoderated postings [Top 20]:
| Groups | Count |
|---|---|
| bit.listserv.catholic | 1 |
| TOTAL: 1 | 1 |
INND Python filter [Top 20]:
| Reason | Count |
|---|---|
| Binary (yEnc) | 759 |
| Bad From (Test User <test-user@nospam.example>) | 40 |
| Bad From (hester holt) | 35 |
| EMP Body Reject | 18 |
| Bad Subject (echolot ping - ignore) | 2 |
| TOTAL: 5 | 854 |
INND misc events:
| Events | Count |
|---|---|
| CCreader | 1 |
| TOTAL: 1 | 1 |
Miscellaneous innd statistics [Top 10]:
| Event | Server | Number |
|---|---|---|
| Including strange strings | ||
| feed1.usenet.blueworldhosting.com | 14 | |
| TOTAL: 1 | 14 | |
| TOTAL: 1 | 14 | |
Outgoing Feeds (innfeed) by Articles:
| Server | Offered | Taken | Refused | Reject | Miss | Spool | %Took | Elapsed | |
|---|---|---|---|---|---|---|---|---|---|
| 1 | feed1.usenet.blueworldhosting.com | 0 | 0 | 0 | 0 | 0 | 0 | 0% | 00:20:31 |
| TOTAL: 1 | 0 | 0 | 0 | 0 | 0 | 0 | 0% | 00:20:31 | |
Outgoing Feeds (innfeed) by Volume:
| Server | AcceptVol | RejectVol | TotalVol | Volume/sec | Vol/Art | Elapsed | |
|---|---|---|---|---|---|---|---|
| 1 | feed1.usenet.blueworldhosting.com | 0.0 KB | 0.0 KB | 0.0 KB | 0.0 KB/s | 0 | 00:20:31 |
| TOTAL: 1 | 0.0 KB | 0.0 KB | 0.0 KB | 0.0 KB/s | 0 | 00:20:31 | |
NNRP readership statistics:
| System | Conn | Arts | Size | Groups | Post | Rej | Elapsed | |
|---|---|---|---|---|---|---|---|---|
| 1 | 199-119-120-158.contegix.com | 99 | 8 | 36.8 KB | 3 | 0 | 0 | 00:54:24 |
| TOTAL: 1 | 99 | 8 | 36.8 KB | 3 | 0 | 0 | 03:58:45 | |
NNRP readership statistics (by domain):
| System | Conn | Arts | Size | Groups | Post | Rej | Elapsed | |
|---|---|---|---|---|---|---|---|---|
| 1 | *.contegix.com | 99 | 8 | 36.8 KB | 3 | 0 | 0 | 00:54:24 |
| 2 | *.stehlik.co.uk | 127 | 0 | 0.0 KB | 0 | 0 | 0 | 03:04:20 |
| TOTAL: 2 | 226 | 8 | 36.8 KB | 3 | 0 | 0 | 03:58:45 | |
NNRP auth users [Top 20]:
| User | Conn |
|---|---|
| jesse | 99 |
| TOTAL: 1 | 99 |
NNRP total resource statistics [Top 20]:
| System | User(ms) | System(ms) | Idle(ms) | Elapsed |
|---|---|---|---|---|
| toma-03.stehlik.co.uk | 26.565 | 10.163 | 0.000 | 03:04:20 |
| 199-119-120-158.contegix.com | 8.451 | 1.124 | 0.660 | 00:54:24 |
| TOTAL: 2 | 35.016 | 11.287 | 0.660 | 03:58:45 |
Curious NNRP server explorers [Top 20]:
| System | Conn |
|---|---|
| toma-03.stehlik.co.uk | 127 |
| TOTAL: 1 | 127 |
NNRP client timeouts [Top 20]:
| System | Conn | Peer |
|---|---|---|
| 199-119-120-158.contegix.com | 99 | 99 |
| toma-03.stehlik.co.uk | 1 | 1 |
| TOTAL: 2 | 100 | 100 |
Newsgroup request counts (by hierarchy):
| Hierarchy | Count | Pct | |
|---|---|---|---|
| 1 | alt | 7 | 100.0% |
| TOTAL: 1 | 7 | 100.0% | |
Newsgroup request counts (by newsgroup) [Top 100]:
| Newsgroup | Count | |
|---|---|---|
| 1 | alt.binaries.e-book | 7 |
| TOTAL: 1 | 7 | |