Log entries by program:
| Program name | Lines | %Lines | Size | %Size |
|---|---|---|---|---|
| inn | 280500 | 52.0% | 34.8 MB | 56.6% |
| nnrpd | 168338 | 31.2% | 17.1 MB | 27.8% |
| innd | 89370 | 16.6% | 9.5 MB | 15.5% |
| innfeed | 703 | 0.1% | 63.3 KB | 0.1% |
| controlchan | 16 | 0.0% | 2.7 KB | 0.0% |
| nocem | 12 | 0.0% | 1.2 KB | 0.0% |
| TOTAL: 6 | 538939 | 100.0% | 61.5 MB | 100.0% |
History cache:
| Reason | Count | %Count |
|---|---|---|
| Do not exist | 280657 | 87.9% |
| Negative hits | 38429 | 12.0% |
| Positive hits | 22 | 0.0% |
| Cache misses | 3 | 0.0% |
| TOTAL: 4 | 319111 | 100.0% |
INND timer:
| Code region | Time | Pct | Invoked | Min(ms) | Avg(ms) | Max(ms) |
|---|---|---|---|---|---|---|
| article cancel | 00:00:05.797 | 0.0% | 407 | 0.000 | 14.243 | 231.500 |
| article cleanup | 00:00:02.562 | 0.0% | 280873 | 0.000 | 0.009 | 0.063 |
| article logging | 00:00:10.256 | 0.0% | 281551 | 0.005 | 0.036 | 0.098 |
| article parse | 00:01:59.980 | 0.0% | 9177009 | 0.004 | 0.013 | 0.021 |
| article write | 00:20:49.714 | 0.0% | 278272 | 0.307 | 4.491 | 15.722 |
| artlog/artcncl | 00:00:00.000 | 0.0% | 28 | 0.000 | 0.000 | 0.000 |
| data move | 00:00:18.351 | 0.0% | 10723534 | 0.000 | 0.002 | 0.005 |
| hisgrep/artcncl | 00:00:03.079 | 0.0% | 426 | 0.000 | 7.228 | 13.000 |
| hishave/artcncl | 00:00:00.000 | 0.0% | 28 | 0.000 | 0.000 | 0.000 |
| history grep | 00:00:00.000 | 0.0% | 0 | 0.000 | 0.000 | 0.000 |
| history lookup | 00:01:16.954 | 0.0% | 319535 | 0.000 | 0.241 | 3.384 |
| history sync | 00:00:15.976 | 0.0% | 700 | 0.000 | 22.823 | 323.500 |
| history write | 00:14:20.819 | 0.0% | 278272 | 0.594 | 3.093 | 15.674 |
| hiswrite/artcncl | 00:00:00.002 | 0.0% | 4 | 0.000 | 0.500 | 1.000 |
| idle | 5124095576071:33:33.824 | 100.0% | 8973264 | 0.624 | 2055745164062.666 | 18446744073700620288.000 |
| nntp read | 00:06:13.107 | 0.0% | 9212692 | 0.006 | 0.040 | 0.101 |
| overview write | 00:02:13.016 | 0.0% | 278272 | 0.107 | 0.478 | 6.240 |
| perl filter | 00:00:21.935 | 0.0% | 279899 | 0.006 | 0.078 | 0.225 |
| python filter | 00:45:03.828 | 0.0% | 307636 | 0.848 | 8.789 | 24.826 |
| site send | 00:00:08.635 | 0.0% | 305197 | 0.006 | 0.028 | 0.089 |
| TOTAL: 5124095576073:14:15.424 | 5124095576073:06:57.152 | 100.0% | - | - | - | - |
INNfeed timer:
| Code region | Time | Pct | Invoked | Min(ms) | Avg(ms) | Max(ms) |
|---|---|---|---|---|---|---|
| article new | 00:00:00.065 | 0.0% | 26763 | 0.000 | 0.002 | 0.006 |
| article prepare | 00:00:00.018 | 0.0% | 107068 | 0.000 | 0.000 | 0.000 |
| article read | 00:00:02.439 | 0.0% | 26763 | 0.000 | 0.091 | 33.000 |
| backlog stats | 00:00:00.113 | 0.0% | 545033 | 0.000 | 0.000 | 0.038 |
| callbacks | 00:00:00.000 | 0.0% | 0 | 0.000 | 0.000 | 0.000 |
| data read | 00:00:01.611 | 0.0% | 54025 | 0.000 | 0.030 | 0.048 |
| data write | 00:01:02.650 | 0.0% | 485091 | 0.000 | 0.129 | 1.000 |
| idle | 5124095576073:08:14.976 | 100.0% | 545033 | 4.168 | 33845187491148.785 | 18446744073700591616.000 |
| status file | 00:00:00.015 | 0.0% | 64 | 0.000 | 0.234 | 1.000 |
| TOTAL: 5124095576073:09:16.416 | 5124095576073:09:20.512 | 100.0% | - | - | - | - |
nnrpd timer:
| Code region | Time | Pct | Invoked | Min(ms) | Avg(ms) | Max(ms) |
|---|---|---|---|---|---|---|
| hisgrep | 00:00:00.964 | 0.0% | 2489 | 0.000 | 0.387 | 19.000 |
| idle | 00:00:00.000 | 0.0% | 0 | 0.000 | 0.000 | 0.000 |
| newnews | 00:00:00.000 | 0.0% | 0 | 0.000 | 0.000 | 0.000 |
| nntpwrite | 01:51:15.194 | 2.3% | 24566076 | 0.000 | 0.272 | 2617.300 |
| readart | 00:02:57.685 | 0.1% | 84114 | 0.000 | 2.112 | 172.000 |
| TOTAL: 79:21:56.890 | 01:54:13.843 | 2.4% | - | - | - | - |
Control commands to INND:
| Command | Number |
|---|---|
| flush | 5 |
| flushlogs | 2 |
| logmode | 2 |
| mode | 275 |
| name | 1 |
| pause | 1 |
| paused | 1 |
| reload | 4 |
| shutdown | 6 |
| TOTAL: 9 | 297 |
Control Channel:
| Sender | newgroup | rmgroup | Other | Bad PGP | DoIt | OK |
|---|---|---|---|---|---|---|
| moderator@dana.de | 0 | 0 | 1 | 0 | 1 | 1 |
| TOTAL | 0 | 0 | 1 | 0 | 1 | 1 |
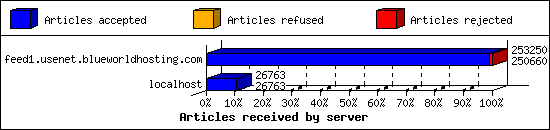
Incoming Feeds (INN):
| Server | Connects | Offered | Taken | Refused | Reject | %Accpt | Elapsed | |
|---|---|---|---|---|---|---|---|---|
| 1 | feed1.usenet.blueworldhosting.com | 1262 | 253250 | 250660 | 1 | 2589 | 98% | 263:16:38 |
| 2 | localhost | 26767 | 26763 | 26763 | 0 | 0 | 100% | 00:08:10 |
| TOTAL: 2 | 28029 | 280013 | 277423 | 1 | 2589 | 99% | 263:24:48 | |
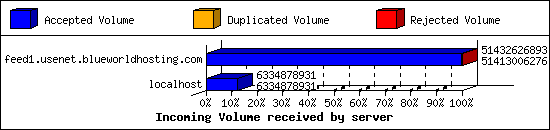
Incoming Volume (INN):
| Server | AcceptVol | DupVol | RejVol | TotalVol | %Acc | Vol/Art | |
|---|---|---|---|---|---|---|---|
| 1 | feed1.usenet.blueworldhosting.com | 47.9 GB | 0.0 KB | 18.7 MB | 47.9 GB | 99% | 198.3 KB |
| 2 | localhost | 5.9 GB | 0.0 KB | 0.0 KB | 5.9 GB | 100% | 231.2 KB |
| TOTAL: 2 | 53.8 GB | 0.0 KB | 18.7 MB | 53.8 GB | 99% | 201.5 KB | |
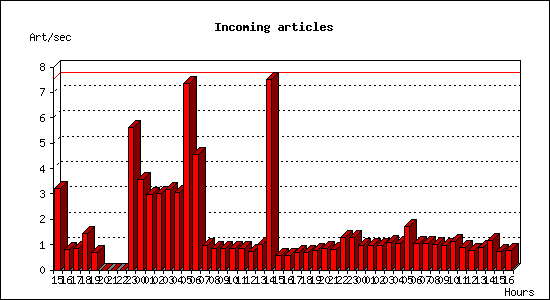
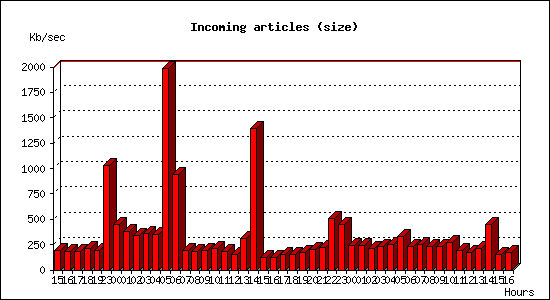
Incoming articles:
| Date | Articles | %Arts | Art/sec | Size | %Size | KB/sec |
|---|---|---|---|---|---|---|
| Jul 1 15:25:19 - 15:59:59 | 6661 | 2.4% | 3.20 | 384.1 MB | 0.0% | 189.02 |
| Jul 1 16:00:00 - 16:59:59 | 2976 | 1.1% | 0.83 | 648.6 MB | 0.0% | 184.50 |
| Jul 1 17:00:00 - 17:59:59 | 3041 | 1.1% | 0.84 | 645.0 MB | 0.0% | 183.47 |
| Jul 1 18:00:00 - 18:59:59 | 5128 | 1.8% | 1.42 | 752.7 MB | 8.1% | 214.09 |
| Jul 1 19:00:00 - 19:59:59 | 2454 | 0.9% | 0.68 | 670.1 MB | 7.2% | 190.62 |
| Jul 1 20:00:00 - 20:59:59 | 0 | 0.0% | 0.00 | 0.0 KB | 0.0% | 0.00 |
| Jul 1 21:00:00 - 21:59:59 | 0 | 0.0% | 0.00 | 0.0 KB | 0.0% | 0.00 |
| Jul 1 22:00:00 - 22:59:59 | 0 | 0.0% | 0.00 | 0.0 KB | 0.0% | 0.00 |
| Jul 1 23:00:00 - 23:59:59 | 20163 | 7.3% | 5.60 | 3.5 GB | 39.0% | 1030.57 |
| Jul 2 00:00:00 - 00:59:59 | 12823 | 4.6% | 3.56 | 1.5 GB | 16.8% | 444.00 |
| Jul 2 01:00:00 - 01:59:59 | 10641 | 3.8% | 2.96 | 1.3 GB | 14.3% | 377.39 |
| Jul 2 02:00:00 - 02:59:59 | 10793 | 3.9% | 3.00 | 1.2 GB | 12.9% | 340.68 |
| Jul 2 03:00:00 - 03:59:59 | 11352 | 4.1% | 3.15 | 1.2 GB | 13.4% | 355.02 |
| Jul 2 04:00:00 - 04:59:59 | 11009 | 4.0% | 3.06 | 1.2 GB | 13.3% | 351.43 |
| Jul 2 05:00:00 - 05:59:59 | 26391 | 9.5% | 7.33 | 6.8 GB | 74.9% | 1980.83 |
| Jul 2 06:00:00 - 06:59:59 | 16331 | 5.9% | 4.54 | 3.2 GB | 35.5% | 939.71 |
| Jul 2 07:00:00 - 07:59:59 | 3450 | 1.2% | 0.96 | 660.6 MB | 7.1% | 187.91 |
| Jul 2 08:00:00 - 08:59:59 | 3116 | 1.1% | 0.87 | 655.8 MB | 7.1% | 186.55 |
| Jul 2 09:00:00 - 09:59:59 | 3080 | 1.1% | 0.86 | 672.7 MB | 7.2% | 191.35 |
| Jul 2 10:00:00 - 10:59:59 | 3091 | 1.1% | 0.86 | 755.4 MB | 8.1% | 214.87 |
| Jul 2 11:00:00 - 11:59:59 | 3020 | 1.1% | 0.84 | 643.5 MB | 6.9% | 183.03 |
| Jul 2 12:00:00 - 12:59:59 | 2562 | 0.9% | 0.71 | 549.7 MB | 5.9% | 156.37 |
| Jul 2 13:00:00 - 13:59:59 | 3610 | 1.3% | 1.00 | 1.1 GB | 11.7% | 308.47 |
| Jul 2 14:00:00 - 14:59:59 | 26975 | 9.7% | 7.49 | 4.8 GB | 52.6% | 1391.16 |
| Jul 2 15:00:00 - 15:59:59 | 2081 | 0.8% | 0.58 | 443.2 MB | 4.8% | 126.08 |
| Jul 2 16:00:00 - 16:59:59 | 2078 | 0.7% | 0.58 | 445.8 MB | 4.8% | 126.81 |
| Jul 2 17:00:00 - 17:59:59 | 2518 | 0.9% | 0.70 | 530.7 MB | 5.7% | 150.96 |
| Jul 2 18:00:00 - 18:59:59 | 2546 | 0.9% | 0.71 | 523.2 MB | 5.6% | 148.83 |
| Jul 2 19:00:00 - 19:59:59 | 2712 | 1.0% | 0.75 | 605.8 MB | 6.5% | 172.32 |
| Jul 2 20:00:00 - 20:59:59 | 3063 | 1.1% | 0.85 | 699.3 MB | 7.5% | 198.91 |
| Jul 2 21:00:00 - 21:59:59 | 2969 | 1.1% | 0.82 | 778.9 MB | 8.4% | 221.57 |
| Jul 2 22:00:00 - 22:59:59 | 4618 | 1.7% | 1.28 | 1.8 GB | 19.3% | 510.26 |
| Jul 2 23:00:00 - 23:59:59 | 4603 | 1.7% | 1.28 | 1.5 GB | 16.8% | 444.39 |
| Jul 3 00:00:00 - 00:59:59 | 3434 | 1.2% | 0.95 | 848.3 MB | 9.1% | 241.30 |
| Jul 3 01:00:00 - 01:59:59 | 3517 | 1.3% | 0.98 | 860.7 MB | 9.3% | 244.82 |
| Jul 3 02:00:00 - 02:59:59 | 3507 | 1.3% | 0.97 | 742.6 MB | 8.0% | 211.23 |
| Jul 3 03:00:00 - 03:59:59 | 3895 | 1.4% | 1.08 | 825.1 MB | 8.9% | 234.69 |
| Jul 3 04:00:00 - 04:59:59 | 3783 | 1.4% | 1.05 | 887.3 MB | 9.5% | 252.40 |
| Jul 3 05:00:00 - 05:59:59 | 6175 | 2.2% | 1.72 | 1.1 GB | 12.4% | 327.32 |
| Jul 3 06:00:00 - 06:59:59 | 3796 | 1.4% | 1.05 | 814.7 MB | 8.8% | 231.74 |
| Jul 3 07:00:00 - 07:59:59 | 3821 | 1.4% | 1.06 | 869.5 MB | 9.4% | 247.32 |
| Jul 3 08:00:00 - 08:59:59 | 3626 | 1.3% | 1.01 | 826.7 MB | 8.9% | 235.14 |
| Jul 3 09:00:00 - 09:59:59 | 3497 | 1.3% | 0.97 | 813.8 MB | 8.8% | 231.47 |
| Jul 3 10:00:00 - 10:59:59 | 4086 | 1.5% | 1.14 | 951.6 MB | 10.2% | 270.69 |
| Jul 3 11:00:00 - 11:59:59 | 3125 | 1.1% | 0.87 | 687.1 MB | 7.4% | 195.43 |
| Jul 3 12:00:00 - 12:59:59 | 2758 | 1.0% | 0.77 | 608.8 MB | 6.6% | 173.18 |
| Jul 3 13:00:00 - 13:59:59 | 3238 | 1.2% | 0.90 | 739.4 MB | 8.0% | 210.31 |
| Jul 3 14:00:00 - 14:59:59 | 4192 | 1.5% | 1.16 | 1.5 GB | 17.0% | 449.08 |
| Jul 3 15:00:00 - 15:59:59 | 2578 | 0.9% | 0.72 | 530.6 MB | 5.7% | 150.92 |
| Jul 3 16:00:00 - 16:50:20 | 2317 | 0.8% | 0.77 | 496.9 MB | 5.3% | 168.47 |
| TOTAL: 49:25:01 | 277200 | 100.0% | 1.56 | 9.1 GB | 100.0% | 53.50 |
Sites sending bad articles:
| Server | Total | Group | Dist | Duplic | Unapp | TooOld | Site | Line | Other | |
|---|---|---|---|---|---|---|---|---|---|---|
| 1 | feed1.usenet.blueworldhosting.com | 3272 | 1614 | 0 | 0 | 4 | 0 | 0 | 0 | 1654 |
| TOTAL: 1 | 3272 | 1614 | 0 | 0 | 4 | 0 | 0 | 0 | 1654 | |
Unwanted newsgroups [Top 20]:
| Newsgroup | Count |
|---|---|
| talk.ukrainian.tg | 556 |
| al.binaries.test | 416 |
| talk.english.tg | 203 |
| finet.binaries.keskustelu | 38 |
| alt.binaries.pictures.wallpaper | 34 |
| alt.binaries.3d.poser | 28 |
| talk.generic.ua.ws | 27 |
| alt.binaries.pictures.scenic | 27 |
| alt.binaries.pictures.nude.celebrities.fake | 21 |
| alt.binaries.mp3.audiobooks | 10 |
| alt.binaries.ebook | 10 |
| panix.chat | 10 |
| alt.binaries.pictures.teen-starlets | 10 |
| alt.binaries.pictures.earlmiller | 9 |
| alt.binaries.test.yenc | 8 |
| alt.binaries.kindle | 8 |
| alt.binaries.nospam.female.bodyhair | 8 |
| alt.binaries.hdtv.german | 6 |
| alt.binaries.sounds.mp3.christmas | 6 |
| alt.binaries.comp | 6 |
| TOTAL: 94 | 1614 |
Supposedly-moderated groups with unmoderated postings [Top 20]:
| Groups | Count |
|---|---|
| bit.listserv.catholic | 2 |
| alt.penthouse.sex.spanking | 2 |
| TOTAL: 2 | 4 |
INND Python filter [Top 20]:
| Reason | Count |
|---|---|
| EMP Body Reject | 662 |
| Bad From (hester holt) | 230 |
| Bad From (Hester Holt) | 16 |
| Bad From (giressfrank1@gmail.com) | 14 |
| Bad From (PHARMA GRADE) | 9 |
| Symbols (162) | 7 |
| Symbols (320) | 6 |
| Symbols (161) | 5 |
| Bad From (FBInCIAnNSATerroristSlayer@yahoo.com) | 4 |
| Crosspost Low Limit Exceeded | 4 |
| AUK Bad Crosspost | 4 |
| Bad Subject (Buy Hydrocodone) | 3 |
| Bad Subject (Buy Xanax) | 3 |
| Bad Subject (Buy Adderall) | 3 |
| Binary (yEnc) | 2 |
| Bad From (dr.jamesmoore202@gmail.com) | 1 |
| TOTAL: 16 | 973 |
NoCeM on Spool:
| Id | Good | Bad | Unique | Total |
|---|---|---|---|---|
| bleachbot@httrack.com | 5 | 0 | 5 | 5 |
| TOTAL: 1 | 5 | 0 | 5 | 5 |
Miscellaneous innd statistics [Top 10]:
| Event | Server | Number |
|---|---|---|
| Including strange strings | ||
| feed1.usenet.blueworldhosting.com | 681 | |
| TOTAL: 1 | 681 | |
| TOTAL: 1 | 681 | |
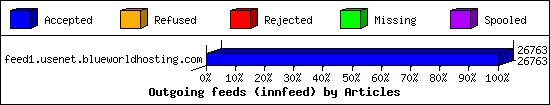
Outgoing Feeds (innfeed) by Articles:
| Server | Offered | Taken | Refused | Reject | Miss | Spool | %Took | Elapsed | |
|---|---|---|---|---|---|---|---|---|---|
| 1 | feed1.usenet.blueworldhosting.com | 26776 | 26763 | 0 | 0 | 0 | 0 | 99% | 01:59:31 |
| TOTAL: 1 | 26776 | 26763 | 0 | 0 | 0 | 0 | 99% | 01:59:31 | |
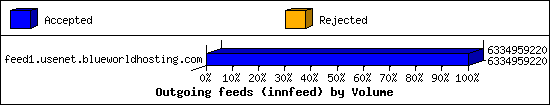
Outgoing Feeds (innfeed) by Volume:
| Server | AcceptVol | RejectVol | TotalVol | Volume/sec | Vol/Art | Elapsed | |
|---|---|---|---|---|---|---|---|
| 1 | feed1.usenet.blueworldhosting.com | 5.9 GB | 0.0 KB | 5.9 GB | 862.7 KB/s | 231.2 KB | 01:59:31 |
| TOTAL: 1 | 5.9 GB | 0.0 KB | 5.9 GB | 862.7 KB/s | 231.2 KB | 01:59:31 | |
NNRP readership statistics:
| System | Conn | Arts | Size | Groups | Post | Rej | Elapsed | |
|---|---|---|---|---|---|---|---|---|
| 1 | 023-084-030-207.res.spectrum.com | 3318 | 1227 | 660.7 MB | 9 | 2 | 0 | 31:35:25 |
| 2 | 192.168.1.146 | 72 | 0 | 0.0 KB | 0 | 26761 | 0 | 05:39:52 |
| TOTAL: 2 | 3390 | 1227 | 660.7 MB | 9 | 26763 | 0 | 79:21:23 | |
NNRP readership statistics (by domain):
| System | Conn | Arts | Size | Groups | Post | Rej | Elapsed | |
|---|---|---|---|---|---|---|---|---|
| 1 | *.res.spectrum.com | 3318 | 1227 | 660.7 MB | 9 | 2 | 0 | 31:35:25 |
| 2 | *.stehlik.co.uk | 1667 | 0 | 0.0 KB | 0 | 0 | 0 | 41:50:09 |
| 3 | unresolved | 76 | 0 | 0.0 KB | 0 | 26761 | 0 | 05:43:33 |
| 4 | *.contegix.com | 20 | 0 | 0.0 KB | 0 | 0 | 0 | 00:12:15 |
| TOTAL: 4 | 5081 | 1227 | 660.7 MB | 9 | 26763 | 0 | 79:21:23 | |
NNRP auth users [Top 20]:
| User | Conn |
|---|---|
| jesse | 3410 |
| TOTAL: 1 | 3410 |
NNRP total resource statistics [Top 20]:
| System | User(ms) | System(ms) | Idle(ms) | Elapsed |
|---|---|---|---|---|
| toma-03.stehlik.co.uk | 377.187 | 135.744 | 0.000 | 41:50:09 |
| 023-084-030-207.res.spectrum.com | 286.921 | 72.563 | 46.652 | 31:35:25 |
| 192.168.1.146 | 209.661 | 195.887 | 0.579 | 05:39:52 |
| 199-119-120-158.contegix.com | 1.526 | 0.291 | 0.108 | 00:12:15 |
| 173.30.87.242 | 1.839 | 6.377 | 0.000 | 00:03:39 |
| 141.105.66.247 | 0.064 | 0.016 | 0.000 | 00:00:00 |
| 104.156.155.24 | 0.057 | 0.024 | 0.000 | 00:00:00 |
| TOTAL: 7 | 877.255 | 410.902 | 47.339 | 79:21:23 |
Curious NNRP server explorers [Top 20]:
| System | Conn |
|---|---|
| toma-03.stehlik.co.uk | 1667 |
| 199-119-120-158.contegix.com | 20 |
| 173.30.87.242 | 2 |
| 141.105.66.247 | 1 |
| 104.156.155.24 | 1 |
| TOTAL: 5 | 1691 |
NNRP client timeouts [Top 20]:
| System | Conn | Peer |
|---|---|---|
| 023-084-030-207.res.spectrum.com | 3214 | 3214 |
| 199-119-120-158.contegix.com | 20 | 20 |
| 192.168.1.146 | 10 | 10 |
| toma-03.stehlik.co.uk | 5 | 5 |
| TOTAL: 4 | 3249 | 3249 |
Newsgroup request counts (by hierarchy):
| Hierarchy | Count | Pct | |
|---|---|---|---|
| 1 | alt | 15 | 78.9% |
| 2 | comp | 4 | 21.1% |
| TOTAL: 2 | 19 | 100.0% | |
Newsgroup request counts (by newsgroup) [Top 100]:
| Newsgroup | Count | |
|---|---|---|
| 1 | alt.binaries.e-book | 6 |
| 2 | comp.os.linux.misc | 4 |
| 3 | alt.checkmate | 4 |
| 4 | alt.binaries.e-book.flood | 4 |
| 5 | alt.binaries.documentaries | 1 |
| TOTAL: 5 | 19 | |