Log entries by program:
| Program name | Lines | %Lines | Size | %Size |
|---|---|---|---|---|
| nnrpd | 56008 | 54.0% | 4.9 MB | 48.1% |
| inn | 45395 | 43.8% | 5.0 MB | 49.2% |
| innd | 2147 | 2.1% | 268.4 KB | 2.6% |
| innfeed | 158 | 0.2% | 15.2 KB | 0.1% |
| nocem | 9 | 0.0% | 0.8 KB | 0.0% |
| controlchan | 1 | 0.0% | 0.1 KB | 0.0% |
| TOTAL: 6 | 103718 | 100.0% | 10.2 MB | 100.0% |
History cache:
| Reason | Count | %Count |
|---|---|---|
| Do not exist | 45046 | 98.7% |
| Negative hits | 578 | 1.3% |
| Positive hits | 7 | 0.0% |
| Cache misses | 0 | 0.0% |
| TOTAL: 4 | 45631 | 100.0% |
INND timer:
| Code region | Time | Pct | Invoked | Min(ms) | Avg(ms) | Max(ms) |
|---|---|---|---|---|---|---|
| article cancel | 00:00:00.740 | 0.0% | 132 | 0.000 | 5.606 | 18.625 |
| article cleanup | 00:00:00.412 | 0.0% | 45308 | 0.000 | 0.009 | 0.095 |
| article logging | 00:00:00.875 | 0.0% | 45630 | 0.000 | 0.019 | 0.101 |
| article parse | 00:00:28.527 | 0.0% | 2279622 | 0.000 | 0.013 | 0.037 |
| article write | 00:08:24.137 | 0.6% | 43713 | 0.317 | 11.533 | 19.034 |
| artlog/artcncl | 00:00:00.000 | 0.0% | 13 | 0.000 | 0.000 | 0.000 |
| artlog/artparse | 00:00:00.000 | 0.0% | 0 | 0.000 | 0.000 | 0.000 |
| data move | 00:00:04.030 | 0.0% | 2531738 | 0.000 | 0.002 | 0.016 |
| hisgrep/artcncl | 00:00:00.123 | 0.0% | 133 | 0.000 | 0.925 | 5.375 |
| hishave/artcncl | 00:00:00.000 | 0.0% | 13 | 0.000 | 0.000 | 0.000 |
| history grep | 00:00:00.000 | 0.0% | 0 | 0.000 | 0.000 | 0.000 |
| history lookup | 00:00:09.774 | 0.0% | 45880 | 0.031 | 0.213 | 2.403 |
| history sync | 00:00:02.149 | 0.0% | 410 | 0.000 | 5.241 | 119.667 |
| history write | 00:00:35.627 | 0.0% | 43713 | 0.266 | 0.815 | 7.053 |
| hiswrite/artcncl | 00:00:00.015 | 0.0% | 6 | 0.000 | 2.500 | 6.500 |
| idle | 23:30:28.989 | 97.9% | 2266474 | 1.133 | 37.339 | 8325.139 |
| nntp read | 00:02:11.382 | 0.2% | 2267881 | 0.000 | 0.058 | 0.154 |
| overview write | 00:07:56.255 | 0.6% | 43713 | 0.153 | 10.895 | 3077.000 |
| perl filter | 00:00:05.397 | 0.0% | 44465 | 0.000 | 0.121 | 0.243 |
| python filter | 00:10:30.858 | 0.7% | 45308 | 0.750 | 13.924 | 26.224 |
| site send | 00:00:01.375 | 0.0% | 43770 | 0.000 | 0.031 | 0.083 |
| TOTAL: 24:01:22.257 | 24:01:00.665 | 100.0% | - | - | - | - |
INNfeed timer:
| Code region | Time | Pct | Invoked | Min(ms) | Avg(ms) | Max(ms) |
|---|---|---|---|---|---|---|
| article new | 00:00:00.000 | 0.0% | 0 | 0.000 | 0.000 | 0.000 |
| article prepare | 00:00:00.000 | 0.0% | 0 | 0.000 | 0.000 | 0.000 |
| article read | 00:00:00.000 | 0.0% | 0 | 0.000 | 0.000 | 0.000 |
| backlog stats | 00:00:00.010 | 0.0% | 3734 | 0.000 | 0.003 | 0.038 |
| callbacks | 00:00:00.000 | 0.0% | 0 | 0.000 | 0.000 | 0.000 |
| data read | 00:00:00.000 | 0.0% | 3 | 0.000 | 0.000 | 0.000 |
| data write | 00:00:00.000 | 0.0% | 3 | 0.000 | 0.000 | 0.000 |
| idle | 23:56:06.486 | 100.0% | 3734 | 16541.526 | 23076.188 | 23332.926 |
| status file | 00:00:00.003 | 0.0% | 6 | 0.500 | 0.500 | 0.500 |
| TOTAL: 23:56:06.557 | 23:56:06.499 | 100.0% | - | - | - | - |
nnrpd timer:
| Code region | Time | Pct | Invoked | Min(ms) | Avg(ms) | Max(ms) |
|---|---|---|---|---|---|---|
| idle | 00:00:00.000 | 0.0% | 0 | 0.000 | 0.000 | 0.000 |
| newnews | 00:00:00.000 | 0.0% | 0 | 0.000 | 0.000 | 0.000 |
| nntpwrite | 00:28:11.222 | 2.0% | 12037660 | 0.000 | 0.140 | 16.961 |
| TOTAL: 23:21:54.507 | 00:28:11.222 | 2.0% | - | - | - | - |
Control commands to INND:
| Command | Number |
|---|---|
| flush | 5 |
| flushlogs | 2 |
| go | 2 |
| logmode | 2 |
| lowmark | 1 |
| mode | 105 |
| name | 2 |
| pause | 2 |
| paused | 2 |
| reload | 2 |
| reserve | 2 |
| TOTAL: 11 | 127 |
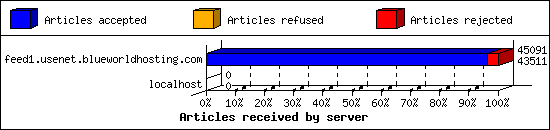
Incoming Feeds (INN):
| Server | Connects | Offered | Taken | Refused | Reject | %Accpt | Elapsed | |
|---|---|---|---|---|---|---|---|---|
| 1 | feed1.usenet.blueworldhosting.com | 53 | 45091 | 43511 | 0 | 1580 | 96% | 26:49:35 |
| 2 | localhost | 3 | 0 | 0 | 0 | 0 | 0% | 00:00:00 |
| TOTAL: 2 | 56 | 45091 | 43511 | 0 | 1580 | 96% | 26:49:35 | |
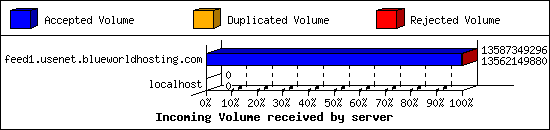
Incoming Volume (INN):
| Server | AcceptVol | DupVol | RejVol | TotalVol | %Acc | Vol/Art | |
|---|---|---|---|---|---|---|---|
| 1 | feed1.usenet.blueworldhosting.com | 12.6 GB | 0.0 KB | 24.0 MB | 12.7 GB | 99% | 294.3 KB |
| 2 | localhost | 0.0 KB | 0.0 KB | 0.0 KB | 0.0 KB | 0% | 0 |
| TOTAL: 2 | 12.6 GB | 0.0 KB | 24.0 MB | 12.7 GB | 99% | 294.3 KB | |
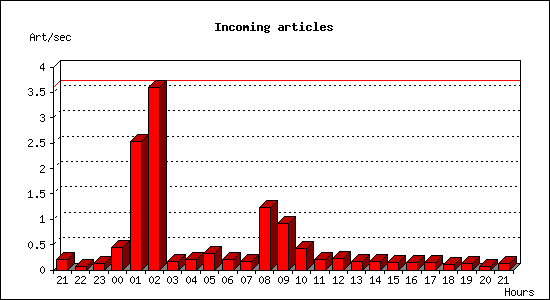
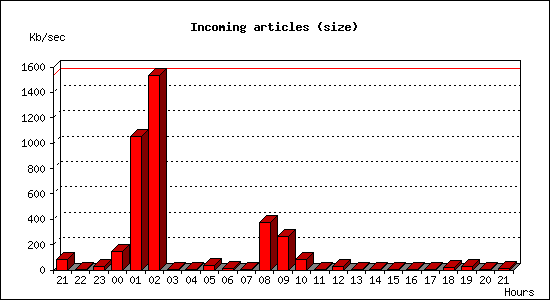
Incoming articles:
| Date | Articles | %Arts | Art/sec | Size | %Size | KB/sec |
|---|---|---|---|---|---|---|
| Jul 22 21:30:00 - 21:59:59 | 363 | 0.8% | 0.20 | 145.4 MB | 1.1% | 82.71 |
| Jul 22 22:00:00 - 22:59:59 | 246 | 0.6% | 0.07 | 1012.8 KB | 0.0% | 0.28 |
| Jul 22 23:00:00 - 23:59:59 | 483 | 1.1% | 0.13 | 88.3 MB | 0.7% | 25.10 |
| Jul 23 00:00:00 - 00:59:59 | 1620 | 3.7% | 0.45 | 516.4 MB | 4.0% | 146.88 |
| Jul 23 01:00:00 - 01:59:59 | 9095 | 20.9% | 2.53 | 3.6 GB | 28.8% | 1053.58 |
| Jul 23 02:00:00 - 02:59:59 | 12941 | 29.8% | 3.59 | 5.3 GB | 41.9% | 1534.31 |
| Jul 23 03:00:00 - 03:59:59 | 581 | 1.3% | 0.16 | 1.5 MB | 0.0% | 0.43 |
| Jul 23 04:00:00 - 04:59:59 | 724 | 1.7% | 0.20 | 2.5 MB | 0.0% | 0.71 |
| Jul 23 05:00:00 - 05:59:59 | 1163 | 2.7% | 0.32 | 117.4 MB | 0.9% | 33.40 |
| Jul 23 06:00:00 - 06:59:59 | 738 | 1.7% | 0.20 | 45.3 MB | 0.4% | 12.90 |
| Jul 23 07:00:00 - 07:59:59 | 616 | 1.4% | 0.17 | 25.8 MB | 0.2% | 7.35 |
| Jul 23 08:00:00 - 08:59:59 | 4449 | 10.2% | 1.24 | 1.3 GB | 10.1% | 370.90 |
| Jul 23 09:00:00 - 09:59:59 | 3329 | 7.7% | 0.92 | 917.8 MB | 7.1% | 261.05 |
| Jul 23 10:00:00 - 10:59:59 | 1526 | 3.5% | 0.42 | 292.1 MB | 2.3% | 83.09 |
| Jul 23 11:00:00 - 11:59:59 | 720 | 1.7% | 0.20 | 3.0 MB | 0.0% | 0.86 |
| Jul 23 12:00:00 - 12:59:59 | 808 | 1.9% | 0.22 | 88.8 MB | 0.7% | 25.27 |
| Jul 23 13:00:00 - 13:59:59 | 626 | 1.4% | 0.17 | 2.1 MB | 0.0% | 0.58 |
| Jul 23 14:00:00 - 14:59:59 | 568 | 1.3% | 0.16 | 2.2 MB | 0.0% | 0.64 |
| Jul 23 15:00:00 - 15:59:59 | 552 | 1.3% | 0.15 | 2.0 MB | 0.0% | 0.57 |
| Jul 23 16:00:00 - 16:59:59 | 510 | 1.2% | 0.14 | 4.9 MB | 0.0% | 1.39 |
| Jul 23 17:00:00 - 17:59:59 | 500 | 1.2% | 0.14 | 10.4 MB | 0.1% | 2.95 |
| Jul 23 18:00:00 - 18:59:59 | 369 | 0.8% | 0.10 | 60.3 MB | 0.5% | 17.15 |
| Jul 23 19:00:00 - 19:59:59 | 436 | 1.0% | 0.12 | 109.7 MB | 0.9% | 31.20 |
| Jul 23 20:00:00 - 20:59:59 | 272 | 0.6% | 0.08 | 1.4 MB | 0.0% | 0.39 |
| Jul 23 21:00:00 - 21:30:00 | 232 | 0.5% | 0.13 | 23.6 MB | 0.2% | 13.42 |
| TOTAL: 24:00:00 | 43467 | 100.0% | 0.50 | 12.6 GB | 100.0% | 152.46 |
Sites sending bad articles:
| Server | Total | Group | Dist | Duplic | Unapp | TooOld | Site | Line | Other | |
|---|---|---|---|---|---|---|---|---|---|---|
| 1 | feed1.usenet.blueworldhosting.com | 1915 | 751 | 0 | 0 | 1 | 0 | 0 | 0 | 1163 |
| TOTAL: 1 | 1915 | 751 | 0 | 0 | 1 | 0 | 0 | 0 | 1163 | |
Unwanted newsgroups [Top 20]:
| Newsgroup | Count |
|---|---|
| talk.ukrainian.tg | 262 |
| al.binaries.test | 201 |
| talk.english.tg | 51 |
| finet.binaries.keskustelu | 21 |
| alt.binaries.pictures.scenic | 20 |
| alt.binaries.pictures.rail | 16 |
| alt.binaries.e-book-flood | 14 |
| alt.binaries.pictures.erotica.vintage | 14 |
| talk.generic.ua.ws | 12 |
| alt.binaries.nospam.female.bodyhair.pubes | 12 |
| alt.culture.underwear | 9 |
| alt.binaries.e-books.flood | 7 |
| alt.binaries.pictures.teen-starlets | 7 |
| alt.binaries.pictures.wallpaper | 7 |
| alt.binaries.test.yenc | 6 |
| alt.binaries.e-books | 5 |
| alt.binaries.comics.dcp | 5 |
| alt.binaries.howard-stern | 5 |
| alt.binaries.classic.tv.shows | 5 |
| alt.binaries.pictures.nude.celebrities.fake | 4 |
| TOTAL: 65 | 751 |
Supposedly-moderated groups with unmoderated postings [Top 20]:
| Groups | Count |
|---|---|
| bit.listserv.catholic | 1 |
| TOTAL: 1 | 1 |
INND Python filter [Top 20]:
| Reason | Count |
|---|---|
| EMP Body Reject | 342 |
| EMP FSL Reject | 264 |
| Bad From (hester holt) | 124 |
| Binary (yEnc) | 75 |
| Bad From (Hester Holt) | 16 |
| Bad From (FBInCIAnNSATerroristSlayer@yahoo.com) | 7 |
| Bad Subject (buy Subutex) | 7 |
| Bad Subject (Buy Xanax) | 5 |
| AUK Bad Crosspost | 1 |
| Bad Subject (Buy Oxycodon) | 1 |
| TOTAL: 10 | 842 |
NoCeM on Spool:
| Id | Good | Bad | Unique | Total |
|---|---|---|---|---|
| bleachbot@httrack.com | 6 | 0 | 6 | 6 |
| TOTAL: 1 | 6 | 0 | 6 | 6 |
Miscellaneous innd statistics [Top 10]:
| Event | Server | Number |
|---|---|---|
| Including strange strings | ||
| feed1.usenet.blueworldhosting.com | 321 | |
| TOTAL: 1 | 321 | |
| TOTAL: 1 | 321 | |
Outgoing Feeds (innfeed) by Articles:
| Server | Offered | Taken | Refused | Reject | Miss | Spool | %Took | Elapsed | |
|---|---|---|---|---|---|---|---|---|---|
| 1 | feed1.usenet.blueworldhosting.com | 0 | 0 | 0 | 0 | 0 | 0 | 0% | 00:10:00 |
| TOTAL: 1 | 0 | 0 | 0 | 0 | 0 | 0 | 0% | 00:10:00 | |
Outgoing Feeds (innfeed) by Volume:
| Server | AcceptVol | RejectVol | TotalVol | Volume/sec | Vol/Art | Elapsed | |
|---|---|---|---|---|---|---|---|
| 1 | feed1.usenet.blueworldhosting.com | 0.0 KB | 0.0 KB | 0.0 KB | 0.0 KB/s | 0 | 00:10:00 |
| TOTAL: 1 | 0.0 KB | 0.0 KB | 0.0 KB | 0.0 KB/s | 0 | 00:10:00 | |
NNRP readership statistics:
| System | Conn | Arts | Size | Groups | Post | Rej | Elapsed | |
|---|---|---|---|---|---|---|---|---|
| 1 | 185.228.137.72 | 1 | 0 | 0.0 KB | 0 | 0 | 0 | 00:00:15 |
| 2 | 185.220.103.120 | 3 | 0 | 0.0 KB | 0 | 0 | 0 | 00:00:10 |
| 3 | toma-03.stehlik.co.uk | 836 | 0 | 0.0 KB | 0 | 0 | 0 | 23:21:12 |
| 4 | 91.203.5.146 | 3 | 0 | 0.0 KB | 0 | 0 | 0 | 00:00:11 |
| TOTAL: 4 | 843 | 0 | 0.0 KB | 0 | 0 | 0 | 23:21:49 | |
NNRP readership statistics (by domain):
| System | Conn | Arts | Size | Groups | Post | Rej | Elapsed | |
|---|---|---|---|---|---|---|---|---|
| 1 | *.stehlik.co.uk | 836 | 0 | 0.0 KB | 0 | 0 | 0 | 23:21:12 |
| 2 | unresolved | 7 | 0 | 0.0 KB | 0 | 0 | 0 | 00:00:37 |
| TOTAL: 2 | 843 | 0 | 0.0 KB | 0 | 0 | 0 | 23:21:49 | |
NNRP total resource statistics [Top 20]:
| System | User(ms) | System(ms) | Idle(ms) | Elapsed |
|---|---|---|---|---|
| toma-03.stehlik.co.uk | 178.707 | 73.275 | 0.000 | 23:21:12 |
| 185.228.137.72 | 0.082 | 0.007 | 0.000 | 00:00:15 |
| 91.203.5.146 | 0.199 | 0.040 | 0.000 | 00:00:11 |
| 185.220.103.120 | 0.207 | 0.031 | 0.000 | 00:00:10 |
| TOTAL: 4 | 179.195 | 73.353 | 0.000 | 23:21:49 |
NNRP client timeouts [Top 20]:
| System | Conn | Peer |
|---|---|---|
| toma-03.stehlik.co.uk | 1 | 0 |
| TOTAL: 1 | 1 | 0 |