Log entries by program:
| Program name | Lines | %Lines | Size | %Size |
|---|---|---|---|---|
| nnrpd | 56868 | 57.1% | 5.1 MB | 51.0% |
| inn | 40793 | 40.9% | 4.6 MB | 46.5% |
| innd | 1855 | 1.9% | 242.7 KB | 2.4% |
| innfeed | 158 | 0.2% | 14.9 KB | 0.1% |
| nocem | 3 | 0.0% | 0.3 KB | 0.0% |
| controlchan | 1 | 0.0% | 0.1 KB | 0.0% |
| TOTAL: 6 | 99678 | 100.0% | 9.9 MB | 100.0% |
History cache:
| Reason | Count | %Count |
|---|---|---|
| Do not exist | 40337 | 98.5% |
| Negative hits | 620 | 1.5% |
| Positive hits | 14 | 0.0% |
| Cache misses | 1 | 0.0% |
| TOTAL: 4 | 40972 | 100.0% |
INND timer:
| Code region | Time | Pct | Invoked | Min(ms) | Avg(ms) | Max(ms) |
|---|---|---|---|---|---|---|
| article cancel | 00:00:00.290 | 0.0% | 86 | 0.000 | 3.372 | 22.000 |
| article cleanup | 00:00:00.420 | 0.0% | 40429 | 0.000 | 0.010 | 0.060 |
| article logging | 00:00:00.739 | 0.0% | 40783 | 0.000 | 0.018 | 0.121 |
| article parse | 00:00:21.339 | 0.0% | 1560112 | 0.000 | 0.014 | 0.046 |
| article write | 00:06:12.824 | 0.4% | 39017 | 0.241 | 9.555 | 21.576 |
| artlog/artcncl | 00:00:00.000 | 0.0% | 17 | 0.000 | 0.000 | 0.000 |
| artlog/artparse | 00:00:00.000 | 0.0% | 0 | 0.000 | 0.000 | 0.000 |
| data move | 00:00:02.711 | 0.0% | 1766810 | 0.000 | 0.002 | 0.010 |
| hisgrep/artcncl | 00:00:00.044 | 0.0% | 99 | 0.000 | 0.444 | 16.000 |
| hishave/artcncl | 00:00:00.000 | 0.0% | 17 | 0.000 | 0.000 | 0.000 |
| history grep | 00:00:00.000 | 0.0% | 0 | 0.000 | 0.000 | 0.000 |
| history lookup | 00:00:16.544 | 0.0% | 41048 | 0.059 | 0.403 | 5.059 |
| history sync | 00:00:02.185 | 0.0% | 405 | 0.333 | 5.395 | 26.333 |
| history write | 00:00:42.699 | 0.0% | 39017 | 0.248 | 1.094 | 7.514 |
| hiswrite/artcncl | 00:00:00.006 | 0.0% | 2 | 1.000 | 3.000 | 5.000 |
| idle | 23:37:58.299 | 98.4% | 1554742 | 1.792 | 54.722 | 14309.881 |
| nntp read | 00:01:29.696 | 0.1% | 1555161 | 0.000 | 0.058 | 0.331 |
| overview write | 00:05:59.623 | 0.4% | 39017 | 0.123 | 9.217 | 5981.946 |
| perl filter | 00:00:03.866 | 0.0% | 39864 | 0.000 | 0.097 | 0.148 |
| python filter | 00:07:46.162 | 0.5% | 40429 | 0.800 | 11.530 | 20.062 |
| site send | 00:00:01.153 | 0.0% | 39080 | 0.000 | 0.030 | 0.147 |
| TOTAL: 24:01:19.765 | 24:00:58.600 | 100.0% | - | - | - | - |
INNfeed timer:
| Code region | Time | Pct | Invoked | Min(ms) | Avg(ms) | Max(ms) |
|---|---|---|---|---|---|---|
| article new | 00:00:00.000 | 0.0% | 0 | 0.000 | 0.000 | 0.000 |
| article prepare | 00:00:00.000 | 0.0% | 0 | 0.000 | 0.000 | 0.000 |
| article read | 00:00:00.000 | 0.0% | 0 | 0.000 | 0.000 | 0.000 |
| backlog stats | 00:00:00.002 | 0.0% | 3727 | 0.000 | 0.001 | 0.038 |
| callbacks | 00:00:00.000 | 0.0% | 0 | 0.000 | 0.000 | 0.000 |
| data read | 00:00:00.000 | 0.0% | 3 | 0.000 | 0.000 | 0.000 |
| data write | 00:00:00.000 | 0.0% | 3 | 0.000 | 0.000 | 0.000 |
| idle | 23:55:01.456 | 100.0% | 3727 | 16112.051 | 23102.081 | 24153.480 |
| status file | 00:00:00.002 | 0.0% | 6 | 0.333 | 0.333 | 0.333 |
| TOTAL: 23:55:01.525 | 23:55:01.460 | 100.0% | - | - | - | - |
nnrpd timer:
| Code region | Time | Pct | Invoked | Min(ms) | Avg(ms) | Max(ms) |
|---|---|---|---|---|---|---|
| hisgrep | 00:00:00.005 | 0.0% | 9 | 0.556 | 0.556 | 0.556 |
| idle | 00:00:00.000 | 0.0% | 0 | 0.000 | 0.000 | 0.000 |
| newnews | 00:00:00.000 | 0.0% | 0 | 0.000 | 0.000 | 0.000 |
| nntpwrite | 00:23:15.307 | 1.5% | 11212284 | 0.000 | 0.124 | 62.050 |
| readart | 00:00:00.126 | 0.0% | 11 | 11.455 | 11.455 | 11.455 |
| TOTAL: 25:47:53.592 | 00:23:15.438 | 1.5% | - | - | - | - |
Control commands to INND:
| Command | Number |
|---|---|
| flush | 5 |
| flushlogs | 2 |
| go | 2 |
| logmode | 2 |
| lowmark | 1 |
| mode | 114 |
| name | 2 |
| pause | 2 |
| paused | 2 |
| reload | 2 |
| reserve | 2 |
| TOTAL: 11 | 136 |
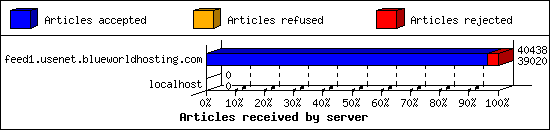
Incoming Feeds (INN):
| Server | Connects | Offered | Taken | Refused | Reject | %Accpt | Elapsed | |
|---|---|---|---|---|---|---|---|---|
| 1 | feed1.usenet.blueworldhosting.com | 54 | 40438 | 39020 | 0 | 1418 | 96% | 27:03:57 |
| 2 | localhost | 2 | 0 | 0 | 0 | 0 | 0% | 00:00:00 |
| TOTAL: 2 | 56 | 40438 | 39020 | 0 | 1418 | 96% | 27:03:57 | |
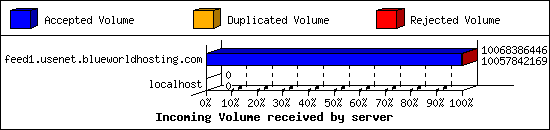
Incoming Volume (INN):
| Server | AcceptVol | DupVol | RejVol | TotalVol | %Acc | Vol/Art | |
|---|---|---|---|---|---|---|---|
| 1 | feed1.usenet.blueworldhosting.com | 9.4 GB | 0.0 KB | 10.1 MB | 9.4 GB | 99% | 243.1 KB |
| 2 | localhost | 0.0 KB | 0.0 KB | 0.0 KB | 0.0 KB | 0% | 0 |
| TOTAL: 2 | 9.4 GB | 0.0 KB | 10.1 MB | 9.4 GB | 99% | 243.1 KB | |
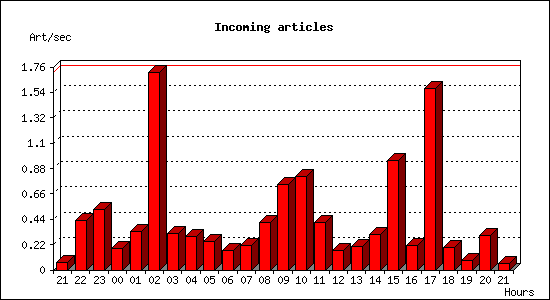
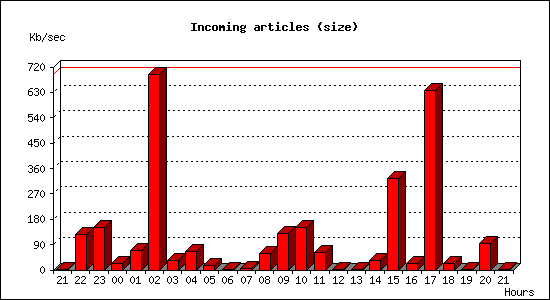
Incoming articles:
| Date | Articles | %Arts | Art/sec | Size | %Size | KB/sec |
|---|---|---|---|---|---|---|
| Jul 27 21:30:00 - 21:59:59 | 115 | 0.3% | 0.06 | 384.8 KB | 0.0% | 0.21 |
| Jul 27 22:00:00 - 22:59:59 | 1558 | 4.0% | 0.43 | 447.3 MB | 4.7% | 127.25 |
| Jul 27 23:00:00 - 23:59:59 | 1900 | 4.9% | 0.53 | 536.1 MB | 5.6% | 152.50 |
| Jul 28 00:00:00 - 00:59:59 | 658 | 1.7% | 0.18 | 83.0 MB | 0.9% | 23.62 |
| Jul 28 01:00:00 - 01:59:59 | 1198 | 3.1% | 0.33 | 237.8 MB | 2.5% | 67.65 |
| Jul 28 02:00:00 - 02:59:59 | 6155 | 15.8% | 1.71 | 2.4 GB | 25.4% | 693.11 |
| Jul 28 03:00:00 - 03:59:59 | 1125 | 2.9% | 0.31 | 123.2 MB | 1.3% | 35.05 |
| Jul 28 04:00:00 - 04:59:59 | 1035 | 2.7% | 0.29 | 225.4 MB | 2.3% | 64.11 |
| Jul 28 05:00:00 - 05:59:59 | 878 | 2.3% | 0.24 | 58.8 MB | 0.6% | 16.72 |
| Jul 28 06:00:00 - 06:59:59 | 613 | 1.6% | 0.17 | 6.1 MB | 0.1% | 1.73 |
| Jul 28 07:00:00 - 07:59:59 | 753 | 1.9% | 0.21 | 21.7 MB | 0.2% | 6.18 |
| Jul 28 08:00:00 - 08:59:59 | 1492 | 3.8% | 0.41 | 202.4 MB | 2.1% | 57.58 |
| Jul 28 09:00:00 - 09:59:59 | 2669 | 6.8% | 0.74 | 452.2 MB | 4.7% | 128.63 |
| Jul 28 10:00:00 - 10:59:59 | 2922 | 7.5% | 0.81 | 531.5 MB | 5.5% | 151.17 |
| Jul 28 11:00:00 - 11:59:59 | 1471 | 3.8% | 0.41 | 222.9 MB | 2.3% | 63.39 |
| Jul 28 12:00:00 - 12:59:59 | 596 | 1.5% | 0.17 | 1.9 MB | 0.0% | 0.55 |
| Jul 28 13:00:00 - 13:59:59 | 730 | 1.9% | 0.20 | 4.6 MB | 0.0% | 1.32 |
| Jul 28 14:00:00 - 14:59:59 | 1117 | 2.9% | 0.31 | 122.5 MB | 1.3% | 34.84 |
| Jul 28 15:00:00 - 15:59:59 | 3409 | 8.7% | 0.95 | 1.1 GB | 11.9% | 326.01 |
| Jul 28 16:00:00 - 16:59:59 | 778 | 2.0% | 0.22 | 78.5 MB | 0.8% | 22.32 |
| Jul 28 17:00:00 - 17:59:59 | 5662 | 14.5% | 1.57 | 2.2 GB | 23.3% | 635.26 |
| Jul 28 18:00:00 - 18:59:59 | 711 | 1.8% | 0.20 | 85.5 MB | 0.9% | 24.32 |
| Jul 28 19:00:00 - 19:59:59 | 296 | 0.8% | 0.08 | 1.3 MB | 0.0% | 0.36 |
| Jul 28 20:00:00 - 20:59:59 | 1068 | 2.7% | 0.30 | 332.2 MB | 3.5% | 94.50 |
| Jul 28 21:00:00 - 21:30:00 | 104 | 0.3% | 0.06 | 321.5 KB | 0.0% | 0.18 |
| TOTAL: 24:00:00 | 39013 | 100.0% | 0.45 | 9.4 GB | 100.0% | 113.68 |
Sites sending bad articles:
| Server | Total | Group | Dist | Duplic | Unapp | TooOld | Site | Line | Other | |
|---|---|---|---|---|---|---|---|---|---|---|
| 1 | feed1.usenet.blueworldhosting.com | 1763 | 844 | 0 | 0 | 1 | 0 | 0 | 0 | 918 |
| TOTAL: 1 | 1763 | 844 | 0 | 0 | 1 | 0 | 0 | 0 | 918 | |
Unwanted newsgroups [Top 20]:
| Newsgroup | Count |
|---|---|
| talk.ukrainian.tg | 308 |
| al.binaries.test | 257 |
| talk.english.tg | 55 |
| alt.binaries.pictures.teen-starlets | 20 |
| talk.generic.ua.ws | 16 |
| fr.petites-annonces.informatique.materiel | 14 |
| alt.binaries.pictures.nude.celebrities.fake | 14 |
| alt.binaries.nospam.female.bodyhair | 13 |
| finet.binaries.keskustelu | 11 |
| alt.binaries.pictures.earlmiller | 9 |
| alt.binaries.pictures.scenic | 9 |
| alt.binaries.test.yenc | 7 |
| alt.binaries.e-books | 7 |
| alt.binaries.sounds.lossless.24bit | 5 |
| alt.binaries.cd.image | 5 |
| alt.binaries.pictures.young.celebrities | 5 |
| talk.english.tw | 4 |
| alt.binaries.erotica.divx | 4 |
| alt.binaries.nospam.multimedia.facials | 4 |
| news.oriens-occasus.ru | 4 |
| TOTAL: 69 | 844 |
Supposedly-moderated groups with unmoderated postings [Top 20]:
| Groups | Count |
|---|---|
| bit.listserv.catholic | 1 |
| TOTAL: 1 | 1 |
INND Python filter [Top 20]:
| Reason | Count |
|---|---|
| EMP Body Reject | 348 |
| EMP FSL Reject | 171 |
| Binary (yEnc) | 24 |
| Bad Subject (buy Subutex) | 6 |
| Bad Subject (Buy Diazepam) | 3 |
| Bad Subject (Buy Adderall) | 3 |
| Bad Subject (Buy Hydrocodone) | 3 |
| Bad Subject (Buy Xanax) | 3 |
| Bad From (FBInCIAnNSATerroristSlayer@yahoo.com) | 2 |
| Crosspost Low Limit Exceeded | 1 |
| Bad From (PHARMA GRADE) | 1 |
| TOTAL: 11 | 565 |
NoCeM on Spool:
| Id | Good | Bad | Unique | Total |
|---|---|---|---|---|
| bleachbot@httrack.com | 2 | 0 | 2 | 2 |
| TOTAL: 1 | 2 | 0 | 2 | 2 |
Miscellaneous innd statistics [Top 10]:
| Event | Server | Number |
|---|---|---|
| Including strange strings | ||
| feed1.usenet.blueworldhosting.com | 353 | |
| TOTAL: 1 | 353 | |
| TOTAL: 1 | 353 | |
Outgoing Feeds (innfeed) by Articles:
| Server | Offered | Taken | Refused | Reject | Miss | Spool | %Took | Elapsed | |
|---|---|---|---|---|---|---|---|---|---|
| 1 | feed1.usenet.blueworldhosting.com | 0 | 0 | 0 | 0 | 0 | 0 | 0% | 00:10:00 |
| TOTAL: 1 | 0 | 0 | 0 | 0 | 0 | 0 | 0% | 00:10:00 | |
Outgoing Feeds (innfeed) by Volume:
| Server | AcceptVol | RejectVol | TotalVol | Volume/sec | Vol/Art | Elapsed | |
|---|---|---|---|---|---|---|---|
| 1 | feed1.usenet.blueworldhosting.com | 0.0 KB | 0.0 KB | 0.0 KB | 0.0 KB/s | 0 | 00:10:00 |
| TOTAL: 1 | 0.0 KB | 0.0 KB | 0.0 KB | 0.0 KB/s | 0 | 00:10:00 | |
NNRP readership statistics:
| System | Conn | Arts | Size | Groups | Post | Rej | Elapsed | |
|---|---|---|---|---|---|---|---|---|
| 1 | 023-084-030-207.res.spectrum.com | 701 | 11 | 17.2 KB | 1 | 0 | 0 | 06:08:54 |
| TOTAL: 1 | 701 | 11 | 17.2 KB | 1 | 0 | 0 | 25:47:43 | |
NNRP readership statistics (by domain):
| System | Conn | Arts | Size | Groups | Post | Rej | Elapsed | |
|---|---|---|---|---|---|---|---|---|
| 1 | *.res.spectrum.com | 701 | 11 | 17.2 KB | 1 | 0 | 0 | 06:08:54 |
| 2 | *.stehlik.co.uk | 781 | 0 | 0.0 KB | 0 | 0 | 0 | 19:38:38 |
| 3 | unresolved | 1 | 0 | 0.0 KB | 0 | 0 | 0 | 00:00:10 |
| TOTAL: 3 | 1483 | 11 | 17.2 KB | 1 | 0 | 0 | 25:47:43 | |
NNRP auth users [Top 20]:
| User | Conn |
|---|---|
| jesse | 701 |
| TOTAL: 1 | 701 |
NNRP total resource statistics [Top 20]:
| System | User(ms) | System(ms) | Idle(ms) | Elapsed |
|---|---|---|---|---|
| toma-03.stehlik.co.uk | 166.097 | 66.711 | 0.000 | 19:38:38 |
| 023-084-030-207.res.spectrum.com | 58.480 | 19.951 | 7.259 | 06:08:54 |
| 94.102.61.39 | 0.070 | 0.008 | 0.000 | 00:00:10 |
| TOTAL: 3 | 224.647 | 86.670 | 7.259 | 25:47:43 |
Curious NNRP server explorers [Top 20]:
| System | Conn |
|---|---|
| toma-03.stehlik.co.uk | 781 |
| 94.102.61.39 | 1 |
| TOTAL: 2 | 782 |
NNRP client timeouts [Top 20]:
| System | Conn | Peer |
|---|---|---|
| 023-084-030-207.res.spectrum.com | 701 | 701 |
| TOTAL: 1 | 701 | 701 |
Newsgroup request counts (by hierarchy):
| Hierarchy | Count | Pct | |
|---|---|---|---|
| 1 | alt | 11 | 100.0% |
| TOTAL: 1 | 11 | 100.0% | |
Newsgroup request counts (by newsgroup) [Top 100]:
| Newsgroup | Count | |
|---|---|---|
| 1 | alt.binaries.e-book.magazines | 11 |
| TOTAL: 1 | 11 | |