
Log entries by program:
| Program name | Lines | %Lines | Size | %Size |
|---|---|---|---|---|
| nnrpd | 83583 | 59.3% | 7.6 MB | 53.7% |
| inn | 55926 | 39.7% | 6.3 MB | 45.0% |
| innd | 1235 | 0.9% | 174.1 KB | 1.2% |
| innfeed | 157 | 0.1% | 14.4 KB | 0.1% |
| nocem | 6 | 0.0% | 0.5 KB | 0.0% |
| controlchan | 1 | 0.0% | 0.0 KB | 0.0% |
| TOTAL: 6 | 140908 | 100.0% | 14.1 MB | 100.0% |
History cache:
| Reason | Count | %Count |
|---|---|---|
| Do not exist | 55558 | 95.2% |
| Negative hits | 2816 | 4.8% |
| Positive hits | 14 | 0.0% |
| Cache misses | 1 | 0.0% |
| TOTAL: 4 | 58389 | 100.0% |
INND timer:
| Code region | Time | Pct | Invoked | Min(ms) | Avg(ms) | Max(ms) |
|---|---|---|---|---|---|---|
| article cancel | 00:00:00.363 | 0.0% | 80 | 0.000 | 4.537 | 23.000 |
| article cleanup | 00:00:00.642 | 0.0% | 55571 | 0.000 | 0.012 | 0.070 |
| article logging | 00:00:00.870 | 0.0% | 55920 | 0.000 | 0.016 | 0.061 |
| article parse | 00:00:49.917 | 0.1% | 4598285 | 0.000 | 0.011 | 0.034 |
| article write | 00:11:35.816 | 0.8% | 53747 | 2.650 | 12.946 | 19.855 |
| artlog/artcncl | 00:00:00.001 | 0.0% | 13 | 0.000 | 0.077 | 1.000 |
| artlog/artparse | 00:00:00.000 | 0.0% | 0 | 0.000 | 0.000 | 0.000 |
| data move | 00:00:05.731 | 0.0% | 5001348 | 0.000 | 0.001 | 0.013 |
| hisgrep/artcncl | 00:00:00.059 | 0.0% | 93 | 0.000 | 0.634 | 7.000 |
| hishave/artcncl | 00:00:00.000 | 0.0% | 15 | 0.000 | 0.000 | 0.000 |
| history grep | 00:00:00.000 | 0.0% | 0 | 0.000 | 0.000 | 0.000 |
| history lookup | 00:00:04.106 | 0.0% | 58387 | 0.021 | 0.070 | 0.287 |
| history sync | 00:00:02.408 | 0.0% | 318 | 0.000 | 7.572 | 12.000 |
| history write | 00:00:55.137 | 0.1% | 55571 | 0.604 | 0.992 | 1.108 |
| idle | 23:26:33.327 | 97.6% | 4596027 | 0.822 | 18.362 | 8693.696 |
| nntp read | 00:01:57.822 | 0.1% | 4595832 | 0.000 | 0.026 | 0.073 |
| overview write | 00:00:14.073 | 0.0% | 53747 | 0.123 | 0.262 | 1.958 |
| perl filter | 00:00:07.791 | 0.0% | 55471 | 0.000 | 0.140 | 0.251 |
| python filter | 00:17:45.393 | 1.2% | 55571 | 0.664 | 19.172 | 31.642 |
| site send | 00:00:01.581 | 0.0% | 53777 | 0.000 | 0.029 | 0.088 |
| TOTAL: 24:00:39.225 | 24:00:15.037 | 100.0% | - | - | - | - |
INNfeed timer:
| Code region | Time | Pct | Invoked | Min(ms) | Avg(ms) | Max(ms) |
|---|---|---|---|---|---|---|
| article new | 00:00:00.000 | 0.0% | 0 | 0.000 | 0.000 | 0.000 |
| article prepare | 00:00:00.000 | 0.0% | 0 | 0.000 | 0.000 | 0.000 |
| article read | 00:00:00.000 | 0.0% | 0 | 0.000 | 0.000 | 0.000 |
| backlog stats | 00:00:00.003 | 0.0% | 3724 | 0.000 | 0.001 | 0.077 |
| callbacks | 00:00:00.000 | 0.0% | 0 | 0.000 | 0.000 | 0.000 |
| data read | 00:00:00.000 | 0.0% | 3 | 0.000 | 0.000 | 0.000 |
| data write | 00:00:00.000 | 0.0% | 3 | 0.000 | 0.000 | 0.000 |
| idle | 23:56:06.345 | 100.0% | 3724 | 17656.971 | 23138.116 | 25079.208 |
| status file | 00:00:00.003 | 0.0% | 6 | 0.500 | 0.500 | 0.500 |
| TOTAL: 23:56:06.386 | 23:56:06.351 | 100.0% | - | - | - | - |
nnrpd timer:
| Code region | Time | Pct | Invoked | Min(ms) | Avg(ms) | Max(ms) |
|---|---|---|---|---|---|---|
| hisgrep | 00:00:00.042 | 0.0% | 15 | 0.000 | 2.800 | 8.000 |
| idle | 00:00:00.000 | 0.0% | 0 | 0.000 | 0.000 | 0.000 |
| newnews | 00:00:00.000 | 0.0% | 0 | 0.000 | 0.000 | 0.000 |
| nntpwrite | 00:24:00.144 | 1.3% | 13296344 | 0.000 | 0.108 | 83.932 |
| readart | 00:00:00.233 | 0.0% | 18 | 0.000 | 12.944 | 53.000 |
| TOTAL: 30:26:17.130 | 00:24:00.419 | 1.3% | - | - | - | - |
Control commands to INND:
| Command | Number |
|---|---|
| flush | 5 |
| flushlogs | 2 |
| go | 1 |
| logmode | 2 |
| mode | 149 |
| name | 2 |
| pause | 1 |
| paused | 1 |
| reload | 2 |
| renumber | 1 |
| TOTAL: 10 | 166 |
Incoming Feeds (INN):
| Server | Connects | Offered | Taken | Refused | Reject | %Accpt | Elapsed | |
|---|---|---|---|---|---|---|---|---|
| 1 | feed1.usenet.blueworldhosting.com | 9 | 55646 | 53821 | 0 | 1825 | 96% | 24:44:43 |
| 2 | localhost | 2 | 0 | 0 | 0 | 0 | 0% | 00:00:00 |
| TOTAL: 2 | 11 | 55646 | 53821 | 0 | 1825 | 96% | 24:44:43 | |
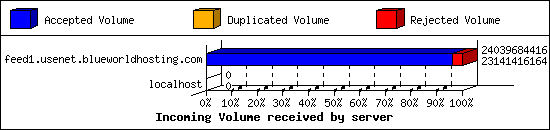
Incoming Volume (INN):
| Server | AcceptVol | DupVol | RejVol | TotalVol | %Acc | Vol/Art | |
|---|---|---|---|---|---|---|---|
| 1 | feed1.usenet.blueworldhosting.com | 21.6 GB | 0.0 KB | 856.7 MB | 22.4 GB | 96% | 421.9 KB |
| 2 | localhost | 0.0 KB | 0.0 KB | 0.0 KB | 0.0 KB | 0% | 0 |
| TOTAL: 2 | 21.6 GB | 0.0 KB | 856.7 MB | 22.4 GB | 96% | 421.9 KB | |
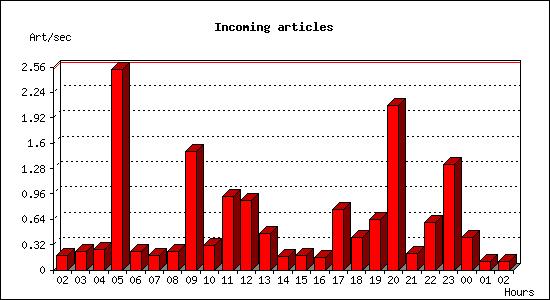
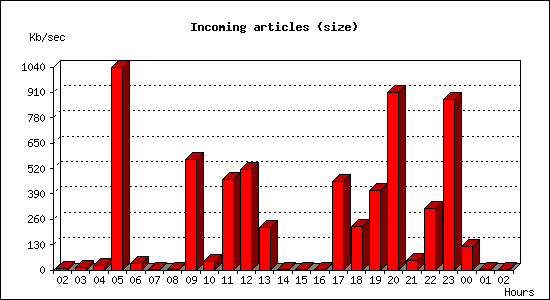
Incoming articles:
| Date | Articles | %Arts | Art/sec | Size | %Size | KB/sec |
|---|---|---|---|---|---|---|
| Aug 12 02:30:00 - 02:59:59 | 320 | 0.6% | 0.18 | 12.7 MB | 0.1% | 7.23 |
| Aug 12 03:00:00 - 03:59:59 | 833 | 1.6% | 0.23 | 43.9 MB | 0.2% | 12.49 |
| Aug 12 04:00:00 - 04:59:59 | 932 | 1.7% | 0.26 | 85.5 MB | 0.4% | 24.31 |
| Aug 12 05:00:00 - 05:59:59 | 9101 | 16.9% | 2.53 | 3.6 GB | 16.5% | 1038.39 |
| Aug 12 06:00:00 - 06:59:59 | 843 | 1.6% | 0.23 | 118.4 MB | 0.5% | 33.67 |
| Aug 12 07:00:00 - 07:59:59 | 677 | 1.3% | 0.19 | 2.2 MB | 0.0% | 0.62 |
| Aug 12 08:00:00 - 08:59:59 | 838 | 1.6% | 0.23 | 15.0 MB | 0.1% | 4.27 |
| Aug 12 09:00:00 - 09:59:59 | 5382 | 10.0% | 1.50 | 2.0 GB | 9.1% | 568.53 |
| Aug 12 10:00:00 - 10:59:59 | 1090 | 2.0% | 0.30 | 157.3 MB | 0.7% | 44.75 |
| Aug 12 11:00:00 - 11:59:59 | 3320 | 6.2% | 0.92 | 1.6 GB | 7.4% | 464.92 |
| Aug 12 12:00:00 - 12:59:59 | 3173 | 5.9% | 0.88 | 1.8 GB | 8.2% | 514.64 |
| Aug 12 13:00:00 - 13:59:59 | 1669 | 3.1% | 0.46 | 761.2 MB | 3.4% | 216.53 |
| Aug 12 14:00:00 - 14:59:59 | 629 | 1.2% | 0.17 | 2.0 MB | 0.0% | 0.56 |
| Aug 12 15:00:00 - 15:59:59 | 641 | 1.2% | 0.18 | 2.2 MB | 0.0% | 0.63 |
| Aug 12 16:00:00 - 16:59:59 | 563 | 1.0% | 0.16 | 2.7 MB | 0.0% | 0.77 |
| Aug 12 17:00:00 - 17:59:59 | 2732 | 5.1% | 0.76 | 1.6 GB | 7.2% | 453.74 |
| Aug 12 18:00:00 - 18:59:59 | 1476 | 2.7% | 0.41 | 786.8 MB | 3.6% | 223.81 |
| Aug 12 19:00:00 - 19:59:59 | 2290 | 4.3% | 0.64 | 1.4 GB | 6.5% | 406.51 |
| Aug 12 20:00:00 - 20:59:59 | 7451 | 13.9% | 2.07 | 3.1 GB | 14.5% | 908.46 |
| Aug 12 21:00:00 - 21:59:59 | 752 | 1.4% | 0.21 | 164.2 MB | 0.7% | 46.70 |
| Aug 12 22:00:00 - 22:59:59 | 2147 | 4.0% | 0.60 | 1.1 GB | 5.0% | 313.68 |
| Aug 12 23:00:00 - 23:59:59 | 4806 | 8.9% | 1.33 | 3.0 GB | 13.9% | 874.53 |
| Aug 13 00:00:00 - 00:59:59 | 1483 | 2.8% | 0.41 | 423.5 MB | 1.9% | 120.45 |
| Aug 13 01:00:00 - 01:59:59 | 389 | 0.7% | 0.11 | 2.1 MB | 0.0% | 0.59 |
| Aug 13 02:00:00 - 02:30:00 | 203 | 0.4% | 0.11 | 726.7 KB | 0.0% | 0.40 |
| TOTAL: 24:00:00 | 53740 | 100.0% | 0.62 | 21.6 GB | 100.0% | 261.56 |
Sites sending bad articles:
| Server | Total | Group | Dist | Duplic | Unapp | TooOld | Site | Line | Other | |
|---|---|---|---|---|---|---|---|---|---|---|
| 1 | feed1.usenet.blueworldhosting.com | 2173 | 1723 | 0 | 0 | 1 | 0 | 0 | 0 | 449 |
| TOTAL: 1 | 2173 | 1723 | 0 | 0 | 1 | 0 | 0 | 0 | 449 | |
Unwanted newsgroups [Top 20]:
| Newsgroup | Count |
|---|---|
| alt.binaries.mom | 611 |
| alt.binaries.de | 598 |
| al.binaries.test | 246 |
| talk.english.tg | 53 |
| finet.binaries.keskustelu | 29 |
| alt.binaries.e-books.flood | 25 |
| talk.generic.ua.ws | 15 |
| alt.binaries.ebook.flood | 11 |
| alt.binaries.sounds.anime | 10 |
| alt.binaries.pictures.nude.celebrities.fake | 10 |
| alt.binaries.pictures.teen-starlets | 10 |
| alt.binaries.test.yenc | 9 |
| alt.binaries.pictures.scenic | 8 |
| alt.binaries.pictures.erotica.vintage | 7 |
| alt.binaries.sounds.lossless | 7 |
| alt.binaries.howard-stern | 6 |
| alt.binaries.nospam.female.bodyhair | 5 |
| talk.english.tw | 5 |
| alt.binaries.sounds.mp3.new-age | 4 |
| alt.binaries.sounds.mp3.soul-rhythm-and-blues | 4 |
| TOTAL: 54 | 1723 |
Supposedly-moderated groups with unmoderated postings [Top 20]:
| Groups | Count |
|---|---|
| bit.listserv.catholic | 1 |
| TOTAL: 1 | 1 |
INND Python filter [Top 20]:
| Reason | Count |
|---|---|
| EMP Body Reject | 65 |
| Bad Subject (Solution manual ) | 18 |
| Bad Subject (Solution Manual ) | 10 |
| Bad From (PHARMA GRADE) | 4 |
| Bad From (FBInCIAnNSATerroristSlayer@yahoo.com) | 2 |
| Bad From (dr.jamesmoore202@gmail.com) | 1 |
| TOTAL: 6 | 100 |
NoCeM on Spool:
| Id | Good | Bad | Unique | Total |
|---|---|---|---|---|
| bleachbot@httrack.com | 2 | 0 | 2 | 2 |
| nocem@novabbs.com | 0 | 1 | 0 | 0 |
| TOTAL: 2 | 2 | 1 | 2 | 2 |
Miscellaneous innd statistics [Top 10]:
| Event | Server | Number |
|---|---|---|
| Bad Message-ID's offered | ||
| localhost | 2 | |
| TOTAL: 1 | 2 | |
| Including strange strings | ||
| feed1.usenet.blueworldhosting.com | 349 | |
| TOTAL: 1 | 349 | |
| TOTAL: 2 | 351 | |
Outgoing Feeds (innfeed) by Articles:
| Server | Offered | Taken | Refused | Reject | Miss | Spool | %Took | Elapsed | |
|---|---|---|---|---|---|---|---|---|---|
| 1 | feed1.usenet.blueworldhosting.com | 0 | 0 | 0 | 0 | 0 | 0 | 0% | 00:10:01 |
| TOTAL: 1 | 0 | 0 | 0 | 0 | 0 | 0 | 0% | 00:10:01 | |

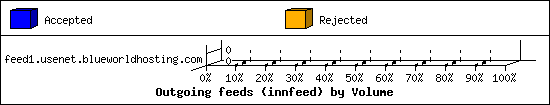
Outgoing Feeds (innfeed) by Volume:
| Server | AcceptVol | RejectVol | TotalVol | Volume/sec | Vol/Art | Elapsed | |
|---|---|---|---|---|---|---|---|
| 1 | feed1.usenet.blueworldhosting.com | 0.0 KB | 0.0 KB | 0.0 KB | 0.0 KB/s | 0 | 00:10:01 |
| TOTAL: 1 | 0.0 KB | 0.0 KB | 0.0 KB | 0.0 KB/s | 0 | 00:10:01 | |
NNRP readership statistics:
| System | Conn | Arts | Size | Groups | Post | Rej | Elapsed | |
|---|---|---|---|---|---|---|---|---|
| 1 | 209.160.121.170 | 139 | 18 | 50.5 KB | 10 | 17629 | 0 | 07:35:16 |
| TOTAL: 1 | 139 | 18 | 50.5 KB | 10 | 17629 | 0 | 30:26:11 | |
NNRP readership statistics (by domain):
| System | Conn | Arts | Size | Groups | Post | Rej | Elapsed | |
|---|---|---|---|---|---|---|---|---|
| 1 | unresolved | 139 | 18 | 50.5 KB | 10 | 17629 | 0 | 07:35:16 |
| 2 | *.stehlik.co.uk | 942 | 0 | 0.0 KB | 0 | 0 | 0 | 22:50:54 |
| TOTAL: 2 | 1081 | 18 | 50.5 KB | 10 | 17629 | 0 | 30:26:11 | |
NNRP auth users [Top 20]:
| User | Conn |
|---|---|
| jesse | 139 |
| TOTAL: 1 | 139 |
NNRP total resource statistics [Top 20]:
| System | User(ms) | System(ms) | Idle(ms) | Elapsed |
|---|---|---|---|---|
| toma-03.stehlik.co.uk | 183.893 | 61.016 | 0.000 | 22:50:54 |
| 209.160.121.170 | 417.080 | 359.953 | 0.737 | 07:35:16 |
| TOTAL: 2 | 600.973 | 420.969 | 0.737 | 30:26:11 |
Curious NNRP server explorers [Top 20]:
| System | Conn |
|---|---|
| toma-03.stehlik.co.uk | 942 |
| TOTAL: 1 | 942 |
NNRP client timeouts [Top 20]:
| System | Conn | Peer |
|---|---|---|
| 209.160.121.170 | 106 | 105 |
| TOTAL: 1 | 106 | 105 |
Newsgroup request counts (by hierarchy):
| Hierarchy | Count | Pct | |
|---|---|---|---|
| 1 | alt | 12 | 100.0% |
| TOTAL: 1 | 12 | 100.0% | |
Newsgroup request counts (by newsgroup) [Top 100]:
| Newsgroup | Count | |
|---|---|---|
| 1 | alt.binaries.documentaries | 9 |
| 2 | alt.security.pgp | 3 |
| TOTAL: 2 | 12 | |