Log entries by program:
| Program name | Lines | %Lines | Size | %Size |
|---|---|---|---|---|
| nnrpd | 68577 | 63.0% | 6.0 MB | 57.1% |
| inn | 38906 | 35.8% | 4.3 MB | 41.2% |
| innd | 1154 | 1.1% | 164.0 KB | 1.5% |
| innfeed | 157 | 0.1% | 14.2 KB | 0.1% |
| nocem | 10 | 0.0% | 0.9 KB | 0.0% |
| controlchan | 1 | 0.0% | 0.0 KB | 0.0% |
| TOTAL: 6 | 108805 | 100.0% | 10.4 MB | 100.0% |
History cache:
| Reason | Count | %Count |
|---|---|---|
| Do not exist | 38576 | 96.2% |
| Negative hits | 1494 | 3.7% |
| Positive hits | 10 | 0.0% |
| Cache misses | 1 | 0.0% |
| TOTAL: 4 | 40081 | 100.0% |
INND timer:
| Code region | Time | Pct | Invoked | Min(ms) | Avg(ms) | Max(ms) |
|---|---|---|---|---|---|---|
| article cancel | 00:00:00.294 | 0.0% | 87 | 0.000 | 3.379 | 21.000 |
| article cleanup | 00:00:00.384 | 0.0% | 38582 | 0.000 | 0.010 | 0.049 |
| article logging | 00:00:00.644 | 0.0% | 38899 | 0.000 | 0.017 | 0.065 |
| article parse | 00:00:26.515 | 0.0% | 2368406 | 0.000 | 0.011 | 0.031 |
| article write | 00:07:03.406 | 0.5% | 37830 | 2.146 | 11.192 | 27.194 |
| artlog/artcncl | 00:00:00.000 | 0.0% | 7 | 0.000 | 0.000 | 0.000 |
| artlog/artparse | 00:00:00.000 | 0.0% | 0 | 0.000 | 0.000 | 0.000 |
| data move | 00:00:03.196 | 0.0% | 2597812 | 0.000 | 0.001 | 0.020 |
| hisgrep/artcncl | 00:00:00.077 | 0.0% | 94 | 0.000 | 0.819 | 7.000 |
| hishave/artcncl | 00:00:00.000 | 0.0% | 11 | 0.000 | 0.000 | 0.000 |
| history grep | 00:00:00.000 | 0.0% | 0 | 0.000 | 0.000 | 0.000 |
| history lookup | 00:00:02.797 | 0.0% | 40082 | 0.000 | 0.070 | 0.417 |
| history sync | 00:00:02.501 | 0.0% | 327 | 0.000 | 7.648 | 10.500 |
| history write | 00:00:37.700 | 0.0% | 38582 | 0.600 | 0.977 | 1.174 |
| idle | 23:41:26.857 | 98.7% | 2365948 | 0.969 | 36.048 | 7795.844 |
| nntp read | 00:01:00.816 | 0.1% | 2365742 | 0.000 | 0.026 | 0.059 |
| overview write | 00:00:10.609 | 0.0% | 37830 | 0.123 | 0.280 | 5.733 |
| perl filter | 00:00:04.392 | 0.0% | 38492 | 0.000 | 0.114 | 0.208 |
| python filter | 00:09:22.605 | 0.7% | 38582 | 0.741 | 14.582 | 31.304 |
| site send | 00:00:01.106 | 0.0% | 37859 | 0.000 | 0.029 | 0.091 |
| TOTAL: 24:00:39.689 | 24:00:23.899 | 100.0% | - | - | - | - |
INNfeed timer:
| Code region | Time | Pct | Invoked | Min(ms) | Avg(ms) | Max(ms) |
|---|---|---|---|---|---|---|
| article new | 00:00:00.000 | 0.0% | 0 | 0.000 | 0.000 | 0.000 |
| article prepare | 00:00:00.000 | 0.0% | 0 | 0.000 | 0.000 | 0.000 |
| article read | 00:00:00.000 | 0.0% | 0 | 0.000 | 0.000 | 0.000 |
| backlog stats | 00:00:00.002 | 0.0% | 3728 | 0.000 | 0.001 | 0.038 |
| callbacks | 00:00:00.000 | 0.0% | 0 | 0.000 | 0.000 | 0.000 |
| data read | 00:00:00.000 | 0.0% | 3 | 0.000 | 0.000 | 0.000 |
| data write | 00:00:00.000 | 0.0% | 3 | 0.000 | 0.000 | 0.000 |
| idle | 23:55:25.705 | 100.0% | 3728 | 17657.176 | 23102.389 | 24200.760 |
| status file | 00:00:00.003 | 0.0% | 6 | 0.250 | 0.500 | 1.000 |
| TOTAL: 23:55:25.746 | 23:55:25.710 | 100.0% | - | - | - | - |
nnrpd timer:
| Code region | Time | Pct | Invoked | Min(ms) | Avg(ms) | Max(ms) |
|---|---|---|---|---|---|---|
| hisgrep | 00:00:00.329 | 0.0% | 1216 | 0.000 | 0.271 | 6.000 |
| idle | 00:00:00.000 | 0.0% | 0 | 0.000 | 0.000 | 0.000 |
| newnews | 00:00:00.000 | 0.0% | 0 | 0.000 | 0.000 | 0.000 |
| nntpwrite | 00:22:47.270 | 1.2% | 13216110 | 0.000 | 0.103 | 154.700 |
| readart | 00:00:00.383 | 0.0% | 14 | 1.000 | 27.357 | 38.000 |
| TOTAL: 32:45:46.083 | 00:22:47.982 | 1.2% | - | - | - | - |
Control commands to INND:
| Command | Number |
|---|---|
| flush | 5 |
| flushlogs | 2 |
| go | 1 |
| logmode | 2 |
| mode | 149 |
| name | 2 |
| pause | 1 |
| paused | 1 |
| reload | 2 |
| renumber | 1 |
| TOTAL: 10 | 166 |
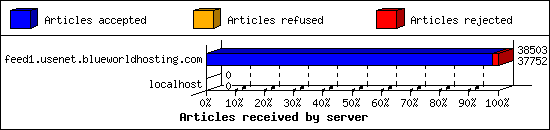
Incoming Feeds (INN):
| Server | Connects | Offered | Taken | Refused | Reject | %Accpt | Elapsed | |
|---|---|---|---|---|---|---|---|---|
| 1 | feed1.usenet.blueworldhosting.com | 8 | 38503 | 37752 | 0 | 751 | 98% | 24:23:09 |
| 2 | localhost | 2 | 0 | 0 | 0 | 0 | 0% | 00:00:00 |
| TOTAL: 2 | 10 | 38503 | 37752 | 0 | 751 | 98% | 24:23:09 | |
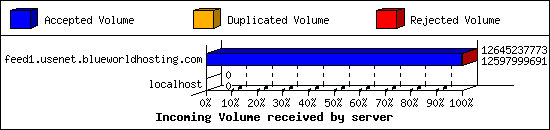
Incoming Volume (INN):
| Server | AcceptVol | DupVol | RejVol | TotalVol | %Acc | Vol/Art | |
|---|---|---|---|---|---|---|---|
| 1 | feed1.usenet.blueworldhosting.com | 11.7 GB | 0.0 KB | 45.0 MB | 11.8 GB | 99% | 320.7 KB |
| 2 | localhost | 0.0 KB | 0.0 KB | 0.0 KB | 0.0 KB | 0% | 0 |
| TOTAL: 2 | 11.7 GB | 0.0 KB | 45.0 MB | 11.8 GB | 99% | 320.7 KB | |
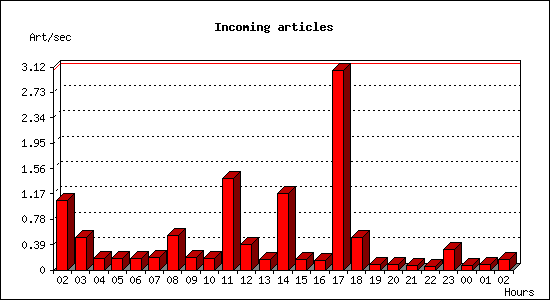
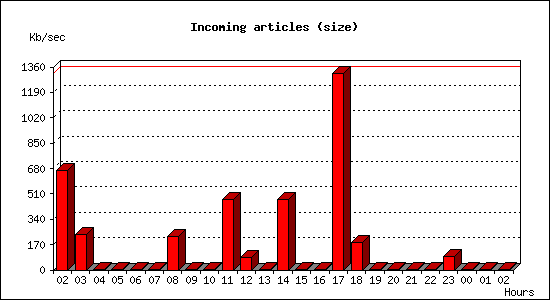
Incoming articles:
| Date | Articles | %Arts | Art/sec | Size | %Size | KB/sec |
|---|---|---|---|---|---|---|
| Aug 13 02:30:00 - 02:59:59 | 1914 | 5.1% | 1.06 | 1.1 GB | 9.8% | 668.74 |
| Aug 13 03:00:00 - 03:59:59 | 1773 | 4.7% | 0.49 | 836.2 MB | 7.0% | 237.86 |
| Aug 13 04:00:00 - 04:59:59 | 649 | 1.7% | 0.18 | 1.8 MB | 0.0% | 0.50 |
| Aug 13 05:00:00 - 05:59:59 | 641 | 1.7% | 0.18 | 3.2 MB | 0.0% | 0.91 |
| Aug 13 06:00:00 - 06:59:59 | 633 | 1.7% | 0.18 | 2.7 MB | 0.0% | 0.78 |
| Aug 13 07:00:00 - 07:59:59 | 696 | 1.8% | 0.19 | 6.0 MB | 0.1% | 1.71 |
| Aug 13 08:00:00 - 08:59:59 | 1926 | 5.1% | 0.54 | 800.0 MB | 6.7% | 227.56 |
| Aug 13 09:00:00 - 09:59:59 | 665 | 1.8% | 0.18 | 2.2 MB | 0.0% | 0.61 |
| Aug 13 10:00:00 - 10:59:59 | 660 | 1.7% | 0.18 | 1.9 MB | 0.0% | 0.55 |
| Aug 13 11:00:00 - 11:59:59 | 5046 | 13.3% | 1.40 | 1.6 GB | 13.8% | 471.83 |
| Aug 13 12:00:00 - 12:59:59 | 1436 | 3.8% | 0.40 | 292.3 MB | 2.4% | 83.15 |
| Aug 13 13:00:00 - 13:59:59 | 595 | 1.6% | 0.17 | 2.0 MB | 0.0% | 0.56 |
| Aug 13 14:00:00 - 14:59:59 | 4258 | 11.3% | 1.18 | 1.6 GB | 13.7% | 469.70 |
| Aug 13 15:00:00 - 15:59:59 | 566 | 1.5% | 0.16 | 1.7 MB | 0.0% | 0.48 |
| Aug 13 16:00:00 - 16:59:59 | 512 | 1.4% | 0.14 | 1.6 MB | 0.0% | 0.44 |
| Aug 13 17:00:00 - 17:59:59 | 11062 | 29.2% | 3.07 | 4.5 GB | 38.5% | 1315.20 |
| Aug 13 18:00:00 - 18:59:59 | 1772 | 4.7% | 0.49 | 640.0 MB | 5.3% | 182.03 |
| Aug 13 19:00:00 - 19:59:59 | 281 | 0.7% | 0.08 | 1.9 MB | 0.0% | 0.55 |
| Aug 13 20:00:00 - 20:59:59 | 302 | 0.8% | 0.08 | 955.7 KB | 0.0% | 0.27 |
| Aug 13 21:00:00 - 21:59:59 | 256 | 0.7% | 0.07 | 1.2 MB | 0.0% | 0.35 |
| Aug 13 22:00:00 - 22:59:59 | 197 | 0.5% | 0.05 | 645.1 KB | 0.0% | 0.18 |
| Aug 13 23:00:00 - 23:59:59 | 1161 | 3.1% | 0.32 | 306.2 MB | 2.5% | 87.10 |
| Aug 14 00:00:00 - 00:59:59 | 262 | 0.7% | 0.07 | 1.0 MB | 0.0% | 0.29 |
| Aug 14 01:00:00 - 01:59:59 | 288 | 0.8% | 0.08 | 870.0 KB | 0.0% | 0.24 |
| Aug 14 02:00:00 - 02:30:00 | 279 | 0.7% | 0.15 | 934.0 KB | 0.0% | 0.52 |
| TOTAL: 24:00:00 | 37830 | 100.0% | 0.44 | 11.7 GB | 100.0% | 142.40 |
Sites sending bad articles:
| Server | Total | Group | Dist | Duplic | Unapp | TooOld | Site | Line | Other | |
|---|---|---|---|---|---|---|---|---|---|---|
| 1 | feed1.usenet.blueworldhosting.com | 1069 | 661 | 0 | 0 | 1 | 0 | 0 | 0 | 407 |
| TOTAL: 1 | 1069 | 661 | 0 | 0 | 1 | 0 | 0 | 0 | 407 | |
Unwanted newsgroups [Top 20]:
| Newsgroup | Count |
|---|---|
| al.binaries.test | 253 |
| alt.binaries.e-book.rpg | 126 |
| talk.english.tg | 67 |
| finet.binaries.keskustelu | 33 |
| alt.binaries.pictures.teen-starlets | 16 |
| alt.binaries.pictures.scenic | 14 |
| talk.generic.ua.ws | 12 |
| alt.binaries.nospam.female.bodyhair.pubes | 11 |
| alt.binaries.test.yenc | 10 |
| alt.binaries.pictures.nude.celebrities.fake | 9 |
| alt.religion.christian.jesus-connection | 9 |
| alt.binaries.howard-stern | 8 |
| wolfsburg.test | 8 |
| alt.binaries.pictures.rail | 7 |
| alt.binaries.multimedia.erotica.amateur | 7 |
| alt.binaries.pictures.wallpaper | 7 |
| alt.binaries.multimedia.videos.music | 3 |
| alt.binaries.adan | 3 |
| alt.binaries.pictures.fashion.youth | 2 |
| alt.binaries.pictures.bras | 2 |
| TOTAL: 62 | 661 |
Supposedly-moderated groups with unmoderated postings [Top 20]:
| Groups | Count |
|---|---|
| bit.listserv.catholic | 1 |
| TOTAL: 1 | 1 |
INND Python filter [Top 20]:
| Reason | Count |
|---|---|
| EMP Body Reject | 85 |
| Bad From (FBInCIAnNSATerroristSlayer@yahoo.com) | 5 |
| TOTAL: 2 | 90 |
NoCeM on Spool:
| Id | Good | Bad | Unique | Total |
|---|---|---|---|---|
| bleachbot@httrack.com | 4 | 0 | 4 | 4 |
| TOTAL: 1 | 4 | 0 | 4 | 4 |
Miscellaneous innd statistics [Top 10]:
| Event | Server | Number |
|---|---|---|
| Including strange strings | ||
| feed1.usenet.blueworldhosting.com | 317 | |
| TOTAL: 1 | 317 | |
| TOTAL: 1 | 317 | |
Outgoing Feeds (innfeed) by Articles:
| Server | Offered | Taken | Refused | Reject | Miss | Spool | %Took | Elapsed | |
|---|---|---|---|---|---|---|---|---|---|
| 1 | feed1.usenet.blueworldhosting.com | 0 | 0 | 0 | 0 | 0 | 0 | 0% | 00:10:00 |
| TOTAL: 1 | 0 | 0 | 0 | 0 | 0 | 0 | 0% | 00:10:00 | |
Outgoing Feeds (innfeed) by Volume:
| Server | AcceptVol | RejectVol | TotalVol | Volume/sec | Vol/Art | Elapsed | |
|---|---|---|---|---|---|---|---|
| 1 | feed1.usenet.blueworldhosting.com | 0.0 KB | 0.0 KB | 0.0 KB | 0.0 KB/s | 0 | 00:10:00 |
| TOTAL: 1 | 0.0 KB | 0.0 KB | 0.0 KB | 0.0 KB/s | 0 | 00:10:00 | |
NNRP readership statistics:
| System | Conn | Arts | Size | Groups | Post | Rej | Elapsed | |
|---|---|---|---|---|---|---|---|---|
| 1 | 023-084-030-207.res.spectrum.com | 13 | 7 | 8.5 KB | 4 | 5 | 0 | 00:06:44 |
| 2 | 209.160.121.170 | 157 | 5 | 13.9 KB | 1 | 2843 | 0 | 01:23:49 |
| 3 | 209.160.120.33 | 23 | 2 | 2.4 KB | 1 | 1 | 0 | 00:10:17 |
| TOTAL: 3 | 193 | 14 | 24.8 KB | 6 | 2849 | 0 | 32:45:40 | |
NNRP readership statistics (by domain):
| System | Conn | Arts | Size | Groups | Post | Rej | Elapsed | |
|---|---|---|---|---|---|---|---|---|
| 1 | unresolved | 182 | 7 | 16.3 KB | 2 | 2844 | 0 | 01:34:24 |
| 2 | *.res.spectrum.com | 13 | 7 | 8.5 KB | 4 | 5 | 0 | 00:06:44 |
| 3 | *.stehlik.co.uk | 922 | 0 | 0.0 KB | 0 | 0 | 0 | 31:04:31 |
| TOTAL: 3 | 1117 | 14 | 24.8 KB | 6 | 2849 | 0 | 32:45:40 | |
NNRP auth users [Top 20]:
| User | Conn |
|---|---|
| jesse | 193 |
| TOTAL: 1 | 193 |
NNRP total resource statistics [Top 20]:
| System | User(ms) | System(ms) | Idle(ms) | Elapsed |
|---|---|---|---|---|
| toma-03.stehlik.co.uk | 180.256 | 59.708 | 0.000 | 31:04:31 |
| 209.160.121.170 | 75.859 | 57.685 | 0.770 | 01:23:49 |
| 209.160.120.33 | 2.926 | 0.655 | 0.104 | 00:10:17 |
| 023-084-030-207.res.spectrum.com | 1.159 | 0.275 | 0.132 | 00:06:44 |
| 209.160.113.138 | 0.063 | 0.032 | 0.005 | 00:00:16 |
| 104.156.155.16 | 0.085 | 0.000 | 0.000 | 00:00:00 |
| TOTAL: 6 | 260.348 | 118.355 | 1.011 | 32:45:40 |
Curious NNRP server explorers [Top 20]:
| System | Conn |
|---|---|
| toma-03.stehlik.co.uk | 922 |
| 209.160.113.138 | 1 |
| 104.156.155.16 | 1 |
| TOTAL: 3 | 924 |
NNRP client timeouts [Top 20]:
| System | Conn | Peer |
|---|---|---|
| 209.160.121.170 | 152 | 152 |
| 209.160.120.33 | 23 | 23 |
| 023-084-030-207.res.spectrum.com | 13 | 13 |
| 209.160.113.138 | 1 | 1 |
| toma-03.stehlik.co.uk | 1 | 1 |
| TOTAL: 5 | 190 | 191 |
Newsgroup request counts (by hierarchy):
| Hierarchy | Count | Pct | |
|---|---|---|---|
| 1 | alt | 7 | 100.0% |
| TOTAL: 1 | 7 | 100.0% | |
Newsgroup request counts (by newsgroup) [Top 100]:
| Newsgroup | Count | |
|---|---|---|
| 1 | alt.test | 6 |
| 2 | alt.binaries.documentaries | 1 |
| TOTAL: 2 | 7 | |