Log entries by program:
| Program name | Lines | %Lines | Size | %Size |
|---|---|---|---|---|
| nnrpd | 79201 | 57.4% | 7.1 MB | 51.9% |
| inn | 56575 | 41.0% | 6.3 MB | 46.0% |
| innd | 2002 | 1.5% | 271.0 KB | 1.9% |
| innfeed | 207 | 0.1% | 21.6 KB | 0.2% |
| controlchan | 28 | 0.0% | 5.3 KB | 0.0% |
| nocem | 5 | 0.0% | 0.7 KB | 0.0% |
| TOTAL: 6 | 138018 | 100.0% | 13.7 MB | 100.0% |
History cache:
| Reason | Count | %Count |
|---|---|---|
| Do not exist | 52581 | 92.8% |
| Negative hits | 2608 | 4.6% |
| Positive hits | 1384 | 2.4% |
| Cache misses | 66 | 0.1% |
| TOTAL: 4 | 56639 | 100.0% |
INND timer:
| Code region | Time | Pct | Invoked | Min(ms) | Avg(ms) | Max(ms) |
|---|---|---|---|---|---|---|
| article cancel | 00:00:00.654 | 0.0% | 1511 | 0.000 | 0.433 | 28.000 |
| article cleanup | 00:00:00.601 | 0.0% | 52585 | 0.000 | 0.011 | 0.042 |
| article logging | 00:00:00.853 | 0.0% | 52949 | 0.000 | 0.016 | 0.080 |
| article parse | 00:00:39.016 | 0.0% | 3678601 | 0.000 | 0.011 | 0.062 |
| article write | 00:10:58.829 | 0.8% | 51718 | 0.576 | 12.739 | 26.339 |
| artlog/artcncl | 00:00:00.015 | 0.0% | 1449 | 0.000 | 0.010 | 0.010 |
| artlog/artparse | 00:00:00.000 | 0.0% | 0 | 0.000 | 0.000 | 0.000 |
| data move | 00:00:04.379 | 0.0% | 4012541 | 0.000 | 0.001 | 0.018 |
| hisgrep/artcncl | 00:00:00.137 | 0.0% | 2960 | 0.000 | 0.046 | 8.000 |
| hishave/artcncl | 00:00:00.003 | 0.0% | 1449 | 0.000 | 0.002 | 0.002 |
| history grep | 00:00:00.000 | 0.0% | 0 | 0.000 | 0.000 | 0.000 |
| history lookup | 00:00:31.279 | 0.0% | 55194 | 0.013 | 0.567 | 5.949 |
| history sync | 00:00:02.499 | 0.0% | 329 | 0.000 | 7.596 | 18.000 |
| history write | 00:01:10.222 | 0.1% | 52585 | 0.485 | 1.335 | 5.417 |
| idle | 23:20:21.062 | 97.9% | 3674487 | 0.730 | 22.866 | 9526.841 |
| nntp read | 00:01:36.226 | 0.1% | 3672737 | 0.000 | 0.026 | 0.068 |
| overview write | 00:00:14.813 | 0.0% | 51718 | 0.123 | 0.286 | 2.070 |
| perl filter | 00:00:05.941 | 0.0% | 52469 | 0.000 | 0.113 | 0.231 |
| python filter | 00:14:01.275 | 1.0% | 52585 | 0.634 | 15.998 | 31.032 |
| site send | 00:00:01.595 | 0.0% | 51775 | 0.000 | 0.031 | 0.106 |
| TOTAL: 23:50:40.194 | 23:49:49.399 | 99.9% | - | - | - | - |
INNfeed timer:
| Code region | Time | Pct | Invoked | Min(ms) | Avg(ms) | Max(ms) |
|---|---|---|---|---|---|---|
| article new | 00:00:00.000 | 0.0% | 0 | 0.000 | 0.000 | 0.000 |
| article prepare | 00:00:00.000 | 0.0% | 0 | 0.000 | 0.000 | 0.000 |
| article read | 00:00:00.000 | 0.0% | 0 | 0.000 | 0.000 | 0.000 |
| backlog stats | 00:00:00.003 | 0.0% | 3706 | 0.000 | 0.001 | 0.038 |
| callbacks | 00:00:00.000 | 0.0% | 0 | 0.000 | 0.000 | 0.000 |
| data read | 00:00:00.000 | 0.0% | 12 | 0.000 | 0.000 | 0.000 |
| data write | 00:00:00.001 | 0.0% | 11 | 0.000 | 0.091 | 0.250 |
| idle | 23:36:42.410 | 100.0% | 3706 | 15355.366 | 22936.430 | 24094.080 |
| status file | 00:00:00.006 | 0.0% | 21 | 0.167 | 0.286 | 0.500 |
| TOTAL: 23:36:42.476 | 23:36:42.420 | 100.0% | - | - | - | - |
nnrpd timer:
| Code region | Time | Pct | Invoked | Min(ms) | Avg(ms) | Max(ms) |
|---|---|---|---|---|---|---|
| hisgrep | 00:00:00.011 | 0.0% | 6 | 0.000 | 1.833 | 8.000 |
| idle | 00:00:01.235 | 0.0% | 7313 | 0.000 | 0.169 | 6.000 |
| newnews | 00:00:00.000 | 0.0% | 0 | 0.000 | 0.000 | 0.000 |
| nntpwrite | 00:22:08.949 | 1.4% | 13230597 | 0.000 | 0.100 | 47.000 |
| readart | 00:00:03.972 | 0.0% | 219 | 0.000 | 18.137 | 33.000 |
| TOTAL: 25:54:07.663 | 00:22:14.167 | 1.4% | - | - | - | - |
Control commands to INND:
| Command | Number |
|---|---|
| flush | 5 |
| flushlogs | 2 |
| go | 2 |
| logmode | 2 |
| mode | 150 |
| name | 2 |
| pause | 2 |
| paused | 2 |
| reload | 6 |
| renumber | 1 |
| shutdown | 3 |
| throttle | 2 |
| xexec | 1 |
| TOTAL: 13 | 180 |
Control Channel:
| Sender | newgroup | rmgroup | Other | Bad PGP | DoIt | OK |
|---|---|---|---|---|---|---|
| group-admin@isc.org | 0 | 0 | 2 | 0 | 2 | 2 |
| TOTAL | 0 | 0 | 2 | 0 | 2 | 2 |
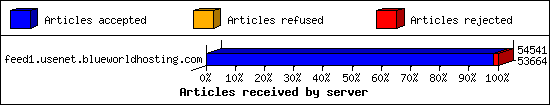
Incoming Feeds (INN):
| Server | Connects | Offered | Taken | Refused | Reject | %Accpt | Elapsed | |
|---|---|---|---|---|---|---|---|---|
| 1 | feed1.usenet.blueworldhosting.com | 182 | 54541 | 53664 | 1 | 876 | 98% | 27:31:17 |
| TOTAL: 1 | 182 | 54541 | 53664 | 1 | 876 | 98% | 27:31:17 | |
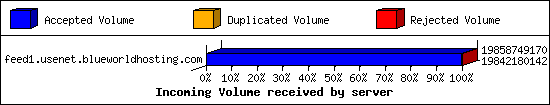
Incoming Volume (INN):
| Server | AcceptVol | DupVol | RejVol | TotalVol | %Acc | Vol/Art | |
|---|---|---|---|---|---|---|---|
| 1 | feed1.usenet.blueworldhosting.com | 18.5 GB | 0.0 KB | 15.8 MB | 18.5 GB | 99% | 355.6 KB |
| TOTAL: 1 | 18.5 GB | 0.0 KB | 15.8 MB | 18.5 GB | 99% | 355.6 KB | |
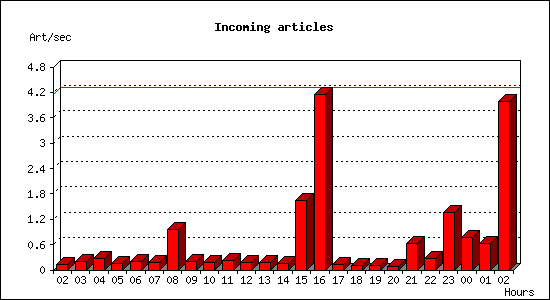
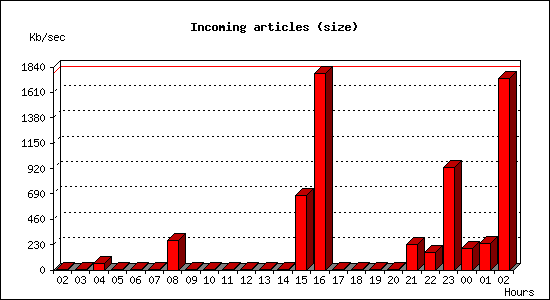
Incoming articles:
| Date | Articles | %Arts | Art/sec | Size | %Size | KB/sec |
|---|---|---|---|---|---|---|
| Aug 15 02:30:00 - 02:59:59 | 251 | 0.5% | 0.14 | 1.8 MB | 0.0% | 1.01 |
| Aug 15 03:00:00 - 03:59:59 | 690 | 1.3% | 0.19 | 18.3 MB | 0.1% | 5.20 |
| Aug 15 04:00:00 - 04:59:59 | 942 | 1.7% | 0.26 | 191.7 MB | 1.0% | 54.54 |
| Aug 15 05:00:00 - 05:59:59 | 538 | 1.0% | 0.15 | 2.3 MB | 0.0% | 0.64 |
| Aug 15 06:00:00 - 06:59:59 | 682 | 1.3% | 0.19 | 3.6 MB | 0.0% | 1.03 |
| Aug 15 07:00:00 - 07:59:59 | 635 | 1.2% | 0.18 | 1.9 MB | 0.0% | 0.54 |
| Aug 15 08:00:00 - 08:59:59 | 3468 | 6.4% | 0.96 | 932.1 MB | 4.9% | 265.13 |
| Aug 15 09:00:00 - 09:59:59 | 687 | 1.3% | 0.19 | 2.9 MB | 0.0% | 0.83 |
| Aug 15 10:00:00 - 10:59:59 | 671 | 1.2% | 0.19 | 9.5 MB | 0.0% | 2.69 |
| Aug 15 11:00:00 - 11:59:59 | 772 | 1.4% | 0.21 | 3.2 MB | 0.0% | 0.91 |
| Aug 15 12:00:00 - 12:59:59 | 634 | 1.2% | 0.18 | 2.9 MB | 0.0% | 0.82 |
| Aug 15 13:00:00 - 13:59:59 | 657 | 1.2% | 0.18 | 2.4 MB | 0.0% | 0.70 |
| Aug 15 14:00:00 - 14:59:59 | 582 | 1.1% | 0.16 | 5.4 MB | 0.0% | 1.54 |
| Aug 15 15:00:00 - 15:59:59 | 5927 | 11.0% | 1.65 | 2.3 GB | 12.5% | 676.50 |
| Aug 15 16:00:00 - 16:59:59 | 14902 | 27.7% | 4.14 | 6.1 GB | 32.9% | 1780.75 |
| Aug 15 17:00:00 - 17:59:59 | 487 | 0.9% | 0.14 | 1.5 MB | 0.0% | 0.43 |
| Aug 15 18:00:00 - 18:59:59 | 372 | 0.7% | 0.10 | 2.6 MB | 0.0% | 0.75 |
| Aug 15 19:00:00 - 19:59:59 | 348 | 0.6% | 0.10 | 1.7 MB | 0.0% | 0.50 |
| Aug 15 20:00:00 - 20:59:59 | 282 | 0.5% | 0.08 | 1.1 MB | 0.0% | 0.31 |
| Aug 15 21:00:00 - 21:59:59 | 2219 | 4.1% | 0.62 | 809.5 MB | 4.3% | 230.25 |
| Aug 15 22:00:00 - 22:59:59 | 988 | 1.8% | 0.27 | 557.5 MB | 2.9% | 158.58 |
| Aug 15 23:00:00 - 23:59:59 | 4917 | 9.1% | 1.37 | 3.2 GB | 17.2% | 931.50 |
| Aug 16 00:00:00 - 00:59:59 | 2769 | 5.1% | 0.77 | 682.7 MB | 3.6% | 194.18 |
| Aug 16 01:00:00 - 01:59:59 | 2291 | 4.3% | 0.64 | 828.7 MB | 4.4% | 235.73 |
| Aug 16 02:00:00 - 02:30:00 | 7172 | 13.3% | 3.98 | 3.0 GB | 16.0% | 1735.75 |
| TOTAL: 24:00:00 | 53883 | 100.0% | 0.62 | 18.6 GB | 100.0% | 225.52 |
Sites sending bad articles:
| Server | Total | Group | Dist | Duplic | Unapp | TooOld | Site | Line | Other | |
|---|---|---|---|---|---|---|---|---|---|---|
| 1 | feed1.usenet.blueworldhosting.com | 1243 | 759 | 0 | 0 | 1 | 0 | 0 | 0 | 483 |
| TOTAL: 1 | 1243 | 759 | 0 | 0 | 1 | 0 | 0 | 0 | 483 | |
Unwanted newsgroups [Top 20]:
| Newsgroup | Count |
|---|---|
| al.binaries.test | 254 |
| talk.ukrainian.tg | 182 |
| talk.english.tg | 54 |
| alt.binaries.e-books.flood | 40 |
| alt.binaries.pictures.teen-starlets | 31 |
| finet.binaries.keskustelu | 30 |
| alt.binaries.pictures.nude.celebrities.fake | 18 |
| talk.generic.ua.ws | 16 |
| alt.binaries.pictures.scenic | 13 |
| talk.english.tw | 8 |
| alt.binaries.pictures.wallpaper | 7 |
| alt.binaries.test.yenc | 6 |
| alt.binaries.sounds.lossless | 6 |
| alt.binaries.3d.poser | 6 |
| alt.binaries.multimedia.erotica.amateur | 5 |
| news.oriens-occasus.ru | 5 |
| alt.binaries.adan | 4 |
| alt.binaries.sounds.mp3.1970s | 4 |
| alt.binaries.sounds.lossless.blues | 4 |
| alt.binaries.sounds.lossless.24bit | 3 |
| TOTAL: 66 | 759 |
Supposedly-moderated groups with unmoderated postings [Top 20]:
| Groups | Count |
|---|---|
| bit.listserv.catholic | 1 |
| TOTAL: 1 | 1 |
INND Python filter [Top 20]:
| Reason | Count |
|---|---|
| EMP Body Reject | 75 |
| Bad From (hclaudioblanco@gmail.com) | 16 |
| Bad Subject (Buy GBL) | 16 |
| Bad Subject (Solution Manual ) | 2 |
| Bad Subject (Buy Adderall) | 2 |
| Bad Subject (Solution manual ) | 2 |
| Bad From (FBInCIAnNSATerroristSlayer@yahoo.com) | 2 |
| Bad From (PHARMA GRADE) | 1 |
| Bad Subject (Buy ketamine) | 1 |
| TOTAL: 9 | 117 |
Miscellaneous innd statistics [Top 10]:
| Event | Server | Number |
|---|---|---|
| Including strange strings | ||
| feed1.usenet.blueworldhosting.com | 366 | |
| TOTAL: 1 | 366 | |
| TOTAL: 1 | 366 | |
Outgoing Feeds (innfeed) by Articles:
| Server | Offered | Taken | Refused | Reject | Miss | Spool | %Took | Elapsed | |
|---|---|---|---|---|---|---|---|---|---|
| 1 | feed1.usenet.blueworldhosting.com | 0 | 0 | 0 | 0 | 0 | 0 | 0% | 00:36:03 |
| TOTAL: 1 | 0 | 0 | 0 | 0 | 0 | 0 | 0% | 00:36:03 | |
Outgoing Feeds (innfeed) by Volume:
| Server | AcceptVol | RejectVol | TotalVol | Volume/sec | Vol/Art | Elapsed | |
|---|---|---|---|---|---|---|---|
| 1 | feed1.usenet.blueworldhosting.com | 0.0 KB | 0.0 KB | 0.0 KB | 0.0 KB/s | 0 | 00:36:03 |
| TOTAL: 1 | 0.0 KB | 0.0 KB | 0.0 KB | 0.0 KB/s | 0 | 00:36:03 | |
NNRP readership statistics:
| System | Conn | Arts | Size | Groups | Post | Rej | Elapsed | |
|---|---|---|---|---|---|---|---|---|
| 1 | 173.30.87.242 | 2 | 212 | 434.8 KB | 2 | 0 | 0 | 00:01:33 |
| 2 | 023-084-030-207.res.spectrum.com | 67 | 4 | 10.1 KB | 1 | 0 | 0 | 00:17:47 |
| 3 | 208.91.71.189 | 32 | 2 | 3.7 KB | 0 | 6411 | 0 | 03:02:47 |
| 4 | spool1.usenet.blueworldhosting.com | 1494 | 0 | 0.0 KB | 0 | 1442 | 0 | 00:02:39 |
| TOTAL: 4 | 1595 | 218 | 448.6 KB | 3 | 7853 | 0 | 25:53:55 | |
NNRP readership statistics (by domain):
| System | Conn | Arts | Size | Groups | Post | Rej | Elapsed | |
|---|---|---|---|---|---|---|---|---|
| 1 | unresolved | 46 | 214 | 438.5 KB | 2 | 6411 | 0 | 03:07:26 |
| 2 | *.res.spectrum.com | 67 | 4 | 10.1 KB | 1 | 0 | 0 | 00:17:47 |
| 3 | *.usenet.blueworldhosting.com | 1494 | 0 | 0.0 KB | 0 | 1442 | 0 | 00:02:39 |
| 4 | *.stehlik.co.uk | 887 | 0 | 0.0 KB | 0 | 0 | 0 | 22:26:03 |
| TOTAL: 4 | 2494 | 218 | 448.6 KB | 3 | 7853 | 0 | 25:53:55 | |
NNRP auth users [Top 20]:
| User | Conn |
|---|---|
| jesse | 110 |
| TOTAL: 1 | 110 |
NNRP total resource statistics [Top 20]:
| System | User(ms) | System(ms) | Idle(ms) | Elapsed |
|---|---|---|---|---|
| toma-03.stehlik.co.uk | 179.244 | 60.738 | 0.000 | 22:26:03 |
| 208.91.71.189 | 149.505 | 130.061 | 0.165 | 03:02:47 |
| 023-084-030-207.res.spectrum.com | 5.395 | 1.035 | 0.322 | 00:17:47 |
| 209.160.113.97 | 0.922 | 0.133 | 0.072 | 00:03:04 |
| spool1.usenet.blueworldhosting.com | 88.526 | 43.392 | 0.000 | 00:02:39 |
| 173.30.87.242 | 0.268 | 0.099 | 0.000 | 00:01:33 |
| 104.156.155.21 | 0.065 | 0.016 | 0.000 | 00:00:00 |
| TOTAL: 7 | 423.925 | 235.474 | 0.559 | 25:53:55 |
Curious NNRP server explorers [Top 20]:
| System | Conn |
|---|---|
| toma-03.stehlik.co.uk | 887 |
| 209.160.113.97 | 11 |
| 104.156.155.21 | 1 |
| TOTAL: 3 | 899 |
NNRP client timeouts [Top 20]:
| System | Conn | Peer |
|---|---|---|
| 023-084-030-207.res.spectrum.com | 67 | 67 |
| 208.91.71.189 | 16 | 14 |
| 209.160.113.97 | 11 | 11 |
| TOTAL: 3 | 94 | 93 |
Newsgroup request counts (by hierarchy):
| Hierarchy | Count | Pct | |
|---|---|---|---|
| 1 | rec | 212 | 99.5% |
| 2 | alt | 1 | 0.5% |
| TOTAL: 2 | 213 | 100.0% | |
Newsgroup request counts (by newsgroup) [Top 100]:
| Newsgroup | Count | |
|---|---|---|
| 1 | rec.food.cooking | 212 |
| 2 | alt.security.pgp | 1 |
| TOTAL: 2 | 213 | |