Log entries by program:
| Program name | Lines | %Lines | Size | %Size |
|---|---|---|---|---|
| inn | 499771 | 81.1% | 44.2 MB | 80.2% |
| nnrpd | 89344 | 14.5% | 8.2 MB | 14.8% |
| innd | 26606 | 4.3% | 2.7 MB | 4.9% |
| innfeed | 158 | 0.0% | 14.8 KB | 0.0% |
| nocem | 9 | 0.0% | 0.9 KB | 0.0% |
| controlchan | 1 | 0.0% | 0.0 KB | 0.0% |
| TOTAL: 6 | 615889 | 100.0% | 55.1 MB | 100.0% |
History cache:
| Reason | Count | %Count |
|---|---|---|
| Do not exist | 498311 | 49.1% |
| Negative hits | 470898 | 46.4% |
| Cache misses | 31832 | 3.1% |
| Positive hits | 13648 | 1.3% |
| TOTAL: 4 | 1014689 | 100.0% |
INND timer:
| Code region | Time | Pct | Invoked | Min(ms) | Avg(ms) | Max(ms) |
|---|---|---|---|---|---|---|
| article cancel | 00:00:01.873 | 0.0% | 310 | 0.000 | 6.042 | 134.000 |
| article cleanup | 00:00:04.805 | 0.0% | 508903 | 0.000 | 0.009 | 0.040 |
| article logging | 00:00:06.210 | 0.0% | 509352 | 0.007 | 0.012 | 0.019 |
| article parse | 00:00:32.299 | 0.0% | 3183688 | 0.000 | 0.010 | 0.041 |
| article write | 00:10:17.290 | 0.7% | 504582 | 0.189 | 1.223 | 10.855 |
| artlog/artcncl | 00:00:00.000 | 0.0% | 14 | 0.000 | 0.000 | 0.000 |
| artlog/artparse | 00:00:00.000 | 0.0% | 0 | 0.000 | 0.000 | 0.000 |
| data move | 00:00:01.950 | 0.0% | 2433369 | 0.000 | 0.001 | 0.004 |
| hisgrep/artcncl | 00:00:00.628 | 0.0% | 324 | 0.000 | 1.938 | 128.000 |
| hishave/artcncl | 00:00:00.000 | 0.0% | 19 | 0.000 | 0.000 | 0.000 |
| history grep | 00:00:00.000 | 0.0% | 0 | 0.000 | 0.000 | 0.000 |
| history lookup | 00:00:37.763 | 0.0% | 1036849 | 0.024 | 0.036 | 0.188 |
| history sync | 00:00:02.453 | 0.0% | 359 | 0.000 | 6.833 | 9.500 |
| history write | 00:07:46.098 | 0.5% | 508840 | 0.856 | 0.916 | 0.968 |
| idle | 23:24:27.010 | 97.5% | 3193475 | 1.663 | 26.387 | 100.138 |
| nntp read | 00:00:54.193 | 0.1% | 3237807 | 0.003 | 0.017 | 0.029 |
| overview write | 00:01:09.012 | 0.1% | 504582 | 0.071 | 0.137 | 0.258 |
| perl filter | 00:00:18.333 | 0.0% | 505427 | 0.012 | 0.036 | 0.123 |
| python filter | 00:12:58.257 | 0.9% | 1033939 | 0.175 | 0.753 | 16.194 |
| site send | 00:00:14.295 | 0.0% | 504628 | 0.018 | 0.028 | 0.039 |
| TOTAL: 24:00:47.257 | 23:59:32.469 | 99.9% | - | - | - | - |
INNfeed timer:
| Code region | Time | Pct | Invoked | Min(ms) | Avg(ms) | Max(ms) |
|---|---|---|---|---|---|---|
| article new | 00:00:00.000 | 0.0% | 0 | 0.000 | 0.000 | 0.000 |
| article prepare | 00:00:00.000 | 0.0% | 0 | 0.000 | 0.000 | 0.000 |
| article read | 00:00:00.000 | 0.0% | 0 | 0.000 | 0.000 | 0.000 |
| backlog stats | 00:00:00.005 | 0.0% | 3731 | 0.000 | 0.001 | 0.077 |
| callbacks | 00:00:00.000 | 0.0% | 0 | 0.000 | 0.000 | 0.000 |
| data read | 00:00:00.000 | 0.0% | 3 | 0.000 | 0.000 | 0.000 |
| data write | 00:00:00.000 | 0.0% | 3 | 0.000 | 0.000 | 0.000 |
| idle | 23:54:39.944 | 100.0% | 3731 | 17507.514 | 23071.548 | 24053.240 |
| status file | 00:00:00.001 | 0.0% | 6 | 0.000 | 0.167 | 0.250 |
| TOTAL: 23:54:39.982 | 23:54:39.950 | 100.0% | - | - | - | - |
nnrpd timer:
| Code region | Time | Pct | Invoked | Min(ms) | Avg(ms) | Max(ms) |
|---|---|---|---|---|---|---|
| hisgrep | 00:00:02.645 | 0.0% | 5248 | 0.000 | 0.504 | 7.333 |
| idle | 00:00:00.000 | 0.0% | 0 | 0.000 | 0.000 | 0.000 |
| newnews | 00:00:00.000 | 0.0% | 0 | 0.000 | 0.000 | 0.000 |
| nntpwrite | 00:27:33.989 | 0.9% | 13202067 | 0.000 | 0.125 | 45.333 |
| readart | 00:00:04.622 | 0.0% | 3451 | 0.000 | 1.339 | 52.000 |
| TOTAL: 52:34:19.601 | 00:27:41.256 | 0.9% | - | - | - | - |
Control commands to INND:
| Command | Number |
|---|---|
| flush | 5 |
| flushlogs | 2 |
| go | 1 |
| logmode | 2 |
| mode | 148 |
| name | 2 |
| pause | 1 |
| paused | 1 |
| reload | 2 |
| renumber | 1 |
| TOTAL: 10 | 165 |
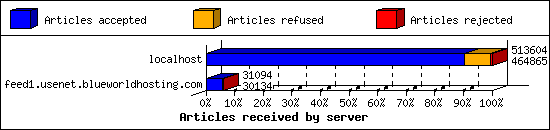
Incoming Feeds (INN):
| Server | Connects | Offered | Taken | Refused | Reject | %Accpt | Elapsed | |
|---|---|---|---|---|---|---|---|---|
| 1 | localhost | 5154 | 513604 | 464865 | 45461 | 3278 | 90% | 05:27:10 |
| 2 | feed1.usenet.blueworldhosting.com | 8 | 31094 | 30134 | 0 | 960 | 96% | 24:46:08 |
| TOTAL: 2 | 5162 | 544698 | 494999 | 45461 | 4238 | 90% | 30:13:18 | |
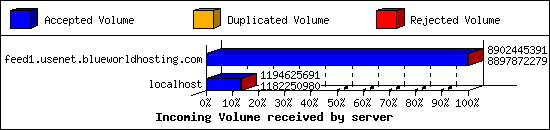
Incoming Volume (INN):
| Server | AcceptVol | DupVol | RejVol | TotalVol | %Acc | Vol/Art | |
|---|---|---|---|---|---|---|---|
| 1 | feed1.usenet.blueworldhosting.com | 8.3 GB | 0.0 KB | 4.4 MB | 8.3 GB | 99% | 279.6 KB |
| 2 | localhost | 1.1 GB | 0.0 KB | 11.8 MB | 1.1 GB | 98% | 2.5 KB |
| TOTAL: 2 | 9.4 GB | 0.0 KB | 16.2 MB | 9.4 GB | 99% | 19.8 KB | |
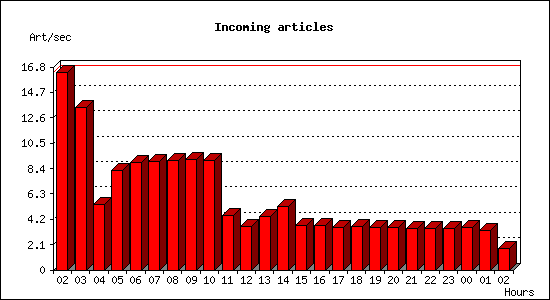
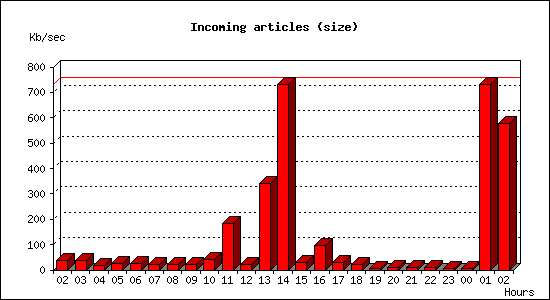
Incoming articles:
| Date | Articles | %Arts | Art/sec | Size | %Size | KB/sec |
|---|---|---|---|---|---|---|
| Aug 20 02:30:00 - 02:59:59 | 29431 | 5.9% | 16.35 | 64.9 MB | 0.7% | 36.90 |
| Aug 20 03:00:00 - 03:59:59 | 48370 | 9.8% | 13.44 | 126.9 MB | 1.3% | 36.11 |
| Aug 20 04:00:00 - 04:59:59 | 19486 | 3.9% | 5.41 | 67.3 MB | 0.7% | 19.15 |
| Aug 20 05:00:00 - 05:59:59 | 29658 | 6.0% | 8.24 | 92.0 MB | 1.0% | 26.16 |
| Aug 20 06:00:00 - 06:59:59 | 31995 | 6.5% | 8.89 | 85.0 MB | 0.9% | 24.16 |
| Aug 20 07:00:00 - 07:59:59 | 32447 | 6.6% | 9.01 | 70.1 MB | 0.7% | 19.93 |
| Aug 20 08:00:00 - 08:59:59 | 32563 | 6.6% | 9.05 | 71.9 MB | 0.7% | 20.44 |
| Aug 20 09:00:00 - 09:59:59 | 32778 | 6.6% | 9.11 | 74.8 MB | 0.8% | 21.27 |
| Aug 20 10:00:00 - 10:59:59 | 32601 | 6.6% | 9.06 | 143.0 MB | 1.5% | 40.69 |
| Aug 20 11:00:00 - 11:59:59 | 16289 | 3.3% | 4.52 | 639.0 MB | 6.6% | 181.75 |
| Aug 20 12:00:00 - 12:59:59 | 12879 | 2.6% | 3.58 | 73.0 MB | 0.8% | 20.77 |
| Aug 20 13:00:00 - 13:59:59 | 15802 | 3.2% | 4.39 | 1.2 GB | 12.5% | 342.49 |
| Aug 20 14:00:00 - 14:59:59 | 18812 | 3.8% | 5.23 | 2.5 GB | 26.6% | 731.95 |
| Aug 20 15:00:00 - 15:59:59 | 13174 | 2.7% | 3.66 | 99.4 MB | 1.0% | 28.26 |
| Aug 20 16:00:00 - 16:59:59 | 13324 | 2.7% | 3.70 | 345.1 MB | 3.6% | 98.17 |
| Aug 20 17:00:00 - 17:59:59 | 12746 | 2.6% | 3.54 | 97.7 MB | 1.0% | 27.80 |
| Aug 20 18:00:00 - 18:59:59 | 12925 | 2.6% | 3.59 | 75.1 MB | 0.8% | 21.35 |
| Aug 20 19:00:00 - 19:59:59 | 12572 | 2.5% | 3.49 | 27.5 MB | 0.3% | 7.81 |
| Aug 20 20:00:00 - 20:59:59 | 12597 | 2.5% | 3.50 | 29.8 MB | 0.3% | 8.49 |
| Aug 20 21:00:00 - 21:59:59 | 12438 | 2.5% | 3.46 | 33.1 MB | 0.3% | 9.43 |
| Aug 20 22:00:00 - 22:59:59 | 12331 | 2.5% | 3.43 | 35.3 MB | 0.4% | 10.05 |
| Aug 20 23:00:00 - 23:59:59 | 12372 | 2.5% | 3.44 | 24.7 MB | 0.3% | 7.03 |
| Aug 21 00:00:00 - 00:59:59 | 12579 | 2.5% | 3.49 | 26.1 MB | 0.3% | 7.44 |
| Aug 21 01:00:00 - 01:59:59 | 11766 | 2.4% | 3.27 | 2.5 GB | 26.6% | 730.02 |
| Aug 21 02:00:00 - 02:30:00 | 3145 | 0.6% | 1.75 | 1017.6 MB | 10.5% | 578.88 |
| TOTAL: 24:00:00 | 495080 | 100.0% | 5.73 | 9.4 GB | 100.0% | 114.52 |
Sites sending bad articles:
| Server | Total | Group | Dist | Duplic | Unapp | TooOld | Site | Line | Other | |
|---|---|---|---|---|---|---|---|---|---|---|
| 1 | localhost | 3385 | 0 | 5 | 0 | 42 | 0 | 0 | 0 | 3338 |
| 2 | feed1.usenet.blueworldhosting.com | 1292 | 791 | 0 | 0 | 1 | 0 | 0 | 0 | 500 |
| TOTAL: 2 | 4677 | 791 | 5 | 0 | 43 | 0 | 0 | 0 | 3838 | |
Unwanted newsgroups [Top 20]:
| Newsgroup | Count |
|---|---|
| talk.ukrainian.tg | 283 |
| al.binaries.test | 227 |
| talk.english.tg | 56 |
| alt.binaries.pictures.teen-starlets | 20 |
| finet.binaries.keskustelu | 20 |
| alt.binaries.pictures.rail | 16 |
| talk.generic.ua.ws | 12 |
| alt.binaries.pictures.wallpaper | 11 |
| alt.binaries.boneless | 10 |
| alt.binaries.pictures.nude.celebrities.fake | 10 |
| talk.english.tw | 7 |
| alt.binaries.sounds.mp3.1950s | 6 |
| alt.binaries.test.yenc | 6 |
| alt.binaries.nospam.female.bodyhair | 6 |
| alt.binaries.multimedia.vintage-film.post-1960 | 6 |
| alt.binaries.pictures.sierra | 5 |
| alt.binaries.pictures.fashion.youth | 5 |
| alt.binaries.pictures.scenic | 4 |
| alt.binaries.adan | 4 |
| alt.binaries.sounds.mp3.new-age | 4 |
| TOTAL: 72 | 791 |
Unwanted distributions [Top 20]:
| Distribution | Count |
|---|---|
| local | 5 |
| TOTAL: 1 | 5 |
Supposedly-moderated groups with unmoderated postings [Top 20]:
| Groups | Count |
|---|---|
| linux.samba | 27 |
| perl.macosx | 3 |
| muc.lists.debian.user | 3 |
| linux.debian.laptop | 3 |
| linux.debian.security | 2 |
| linux.debian.devel | 1 |
| linux.debian.maint.gtk.gnome | 1 |
| linux.gentoo.dev | 1 |
| linux.test | 1 |
| bit.listserv.catholic | 1 |
| TOTAL: 10 | 43 |
INND Python filter [Top 20]:
| Reason | Count |
|---|---|
| EMP Body Reject | 2210 |
| Bad From (MI5Victim@mi5.gov.uk) | 723 |
| OS2 Crosspost | 244 |
| Binary (uuEnc) | 51 |
| Binary (base64) | 36 |
| Bad Subject (Buy Ketamine) | 18 |
| Binary (yEnc) | 12 |
| Bad Subject (Solution manual ) | 9 |
| Bad From (FBInCIAnNSATerroristSlayer@yahoo.com) | 5 |
| Bad Subject (Buy GBL) | 5 |
| Bad From (huhai102@gmail.com) | 4 |
| AUK Bad Crosspost | 4 |
| Bad Subject (Solution Manual ) | 2 |
| Bad From (giannicipolla@protonmail.com) | 1 |
| Crosspost Low Limit Exceeded | 1 |
| Bad From (pmptraining66@gmail.com) | 1 |
| TOTAL: 16 | 3326 |
NoCeM on Spool:
| Id | Good | Bad | Unique | Total |
|---|---|---|---|---|
| bleachbot@httrack.com | 4 | 0 | 5 | 5 |
| TOTAL: 1 | 4 | 0 | 5 | 5 |
Miscellaneous innd statistics [Top 10]:
| Event | Server | Number |
|---|---|---|
| Bad Message-ID's offered | ||
| localhost | 1572 | |
| TOTAL: 1 | 1572 | |
| Including strange strings | ||
| feed1.usenet.blueworldhosting.com | 336 | |
| localhost | 107 | |
| TOTAL: 2 | 443 | |
| TOTAL: 2 | 2015 | |
Outgoing Feeds (innfeed) by Articles:
| Server | Offered | Taken | Refused | Reject | Miss | Spool | %Took | Elapsed | |
|---|---|---|---|---|---|---|---|---|---|
| 1 | feed1.usenet.blueworldhosting.com | 0 | 0 | 0 | 0 | 0 | 0 | 0% | 00:10:00 |
| TOTAL: 1 | 0 | 0 | 0 | 0 | 0 | 0 | 0% | 00:10:00 | |
Outgoing Feeds (innfeed) by Volume:
| Server | AcceptVol | RejectVol | TotalVol | Volume/sec | Vol/Art | Elapsed | |
|---|---|---|---|---|---|---|---|
| 1 | feed1.usenet.blueworldhosting.com | 0.0 KB | 0.0 KB | 0.0 KB | 0.0 KB/s | 0 | 00:10:00 |
| TOTAL: 1 | 0.0 KB | 0.0 KB | 0.0 KB | 0.0 KB/s | 0 | 00:10:00 | |
NNRP readership statistics:
| System | Conn | Arts | Size | Groups | Post | Rej | Elapsed | |
|---|---|---|---|---|---|---|---|---|
| 1 | 173.30.87.242 | 3 | 45 | 134.6 KB | 4 | 0 | 0 | 00:03:00 |
| 2 | 208.91.70.131 | 932 | 10 | 33.2 KB | 0 | 0 | 0 | 09:08:30 |
| 3 | 023-084-030-207.res.spectrum.com | 781 | 1 | 2.5 KB | 0 | 0 | 0 | 07:21:50 |
| 4 | 208.91.69.126 | 10 | 0 | 0.0 KB | 0 | 3394 | 0 | 02:07:12 |
| TOTAL: 4 | 1726 | 56 | 170.3 KB | 4 | 3394 | 0 | 52:33:54 | |
NNRP readership statistics (by domain):
| System | Conn | Arts | Size | Groups | Post | Rej | Elapsed | |
|---|---|---|---|---|---|---|---|---|
| 1 | unresolved | 2123 | 55 | 167.8 KB | 4 | 3394 | 0 | 22:38:40 |
| 2 | *.res.spectrum.com | 781 | 1 | 2.5 KB | 0 | 0 | 0 | 07:21:50 |
| 3 | *.riverside.rocks | 1 | 0 | 0.0 KB | 0 | 0 | 0 | 00:00:00 |
| 4 | *.stehlik.co.uk | 890 | 0 | 0.0 KB | 0 | 0 | 0 | 22:33:22 |
| 5 | *.darklab.sh | 2 | 0 | 0.0 KB | 0 | 0 | 0 | 00:00:00 |
| 6 | *.zbau.f3netze.de | 1 | 0 | 0.0 KB | 0 | 0 | 0 | 00:00:00 |
| TOTAL: 6 | 3798 | 56 | 170.3 KB | 4 | 3394 | 0 | 52:33:54 | |
NNRP auth users [Top 20]:
| User | Conn |
|---|---|
| jesse | 2893 |
| TOTAL: 1 | 2893 |
NNRP total resource statistics [Top 20]:
| System | User(ms) | System(ms) | Idle(ms) | Elapsed |
|---|---|---|---|---|
| toma-03.stehlik.co.uk | 176.832 | 59.868 | 0.000 | 22:33:22 |
| 208.91.71.10 | 95.143 | 25.697 | 17.797 | 10:43:58 |
| 208.91.70.131 | 75.945 | 15.246 | 8.364 | 09:08:30 |
| 023-084-030-207.res.spectrum.com | 62.666 | 12.153 | 4.995 | 07:21:50 |
| 208.91.69.126 | 80.577 | 72.741 | 0.052 | 02:07:12 |
| 208.91.70.16 | 4.625 | 0.692 | 0.302 | 00:32:57 |
| 173.30.87.242 | 0.329 | 0.040 | 0.000 | 00:03:00 |
| 23.129.64.250 | 0.064 | 0.016 | 0.000 | 00:02:52 |
| 185.220.101.174 | 0.066 | 0.015 | 0.000 | 00:00:05 |
| 185.220.101.159 | 0.220 | 0.022 | 0.000 | 00:00:02 |
| 185.220.101.172 | 0.124 | 0.028 | 0.000 | 00:00:00 |
| TOTAL: 11 | 496.591 | 186.518 | 31.510 | 52:33:54 |
Curious NNRP server explorers [Top 20]:
| System | Conn |
|---|---|
| 208.91.71.10 | 1140 |
| toma-03.stehlik.co.uk | 890 |
| 208.91.70.16 | 30 |
| 185.220.101.159 | 3 |
| 185.220.101.172 | 3 |
| tor-exit-01.darklab.sh | 2 |
| 185.220.101.174 | 1 |
| tor-exit4.riverside.rocks | 1 |
| 23.129.64.250 | 1 |
| tor-exit-11.zbau.f3netze.de | 1 |
| TOTAL: 10 | 2072 |
NNRP client timeouts [Top 20]:
| System | Conn | Peer |
|---|---|---|
| 208.91.71.10 | 1140 | 1140 |
| 208.91.70.131 | 932 | 932 |
| 023-084-030-207.res.spectrum.com | 781 | 781 |
| 208.91.70.16 | 60 | 60 |
| TOTAL: 4 | 2913 | 2914 |
Newsgroup request counts (by hierarchy):
| Hierarchy | Count | Pct | |
|---|---|---|---|
| 1 | rec | 45 | 100.0% |
| TOTAL: 1 | 45 | 100.0% | |
Newsgroup request counts (by newsgroup) [Top 100]:
| Newsgroup | Count | |
|---|---|---|
| 1 | rec.food.cooking | 45 |
| TOTAL: 1 | 45 | |