Log entries by program:
| Program name | Lines | %Lines | Size | %Size |
|---|---|---|---|---|
| nnrpd | 73462 | 60.7% | 6.6 MB | 55.2% |
| inn | 46094 | 38.1% | 5.1 MB | 43.2% |
| innd | 1334 | 1.1% | 184.0 KB | 1.5% |
| innfeed | 157 | 0.1% | 14.3 KB | 0.1% |
| nocem | 10 | 0.0% | 0.9 KB | 0.0% |
| controlchan | 1 | 0.0% | 0.1 KB | 0.0% |
| TOTAL: 6 | 121058 | 100.0% | 11.9 MB | 100.0% |
History cache:
| Reason | Count | %Count |
|---|---|---|
| Do not exist | 45747 | 91.5% |
| Negative hits | 4252 | 8.5% |
| Cache misses | 12 | 0.0% |
| Positive hits | 9 | 0.0% |
| TOTAL: 4 | 50020 | 100.0% |
INND timer:
| Code region | Time | Pct | Invoked | Min(ms) | Avg(ms) | Max(ms) |
|---|---|---|---|---|---|---|
| article cancel | 00:00:00.662 | 0.0% | 74 | 0.000 | 8.946 | 35.000 |
| article cleanup | 00:00:00.485 | 0.0% | 45825 | 0.000 | 0.011 | 0.038 |
| article logging | 00:00:00.729 | 0.0% | 46126 | 0.000 | 0.016 | 0.065 |
| article parse | 00:00:38.604 | 0.0% | 3626213 | 0.000 | 0.011 | 0.045 |
| article write | 00:11:02.638 | 0.8% | 43787 | 2.620 | 15.133 | 23.333 |
| artlog/artcncl | 00:00:00.000 | 0.0% | 17 | 0.000 | 0.000 | 0.000 |
| artlog/artparse | 00:00:00.000 | 0.0% | 0 | 0.000 | 0.000 | 0.000 |
| data move | 00:00:03.130 | 0.0% | 3936280 | 0.000 | 0.001 | 0.017 |
| hisgrep/artcncl | 00:00:00.118 | 0.0% | 91 | 0.000 | 1.297 | 3.500 |
| hishave/artcncl | 00:00:00.000 | 0.0% | 21 | 0.000 | 0.000 | 0.000 |
| history grep | 00:00:00.000 | 0.0% | 0 | 0.000 | 0.000 | 0.000 |
| history lookup | 00:00:06.175 | 0.0% | 50077 | 0.041 | 0.123 | 0.315 |
| history sync | 00:00:02.460 | 0.0% | 333 | 0.000 | 7.387 | 15.333 |
| history write | 00:00:47.120 | 0.1% | 45825 | 0.640 | 1.028 | 1.750 |
| idle | 23:32:23.620 | 98.0% | 3624981 | 1.064 | 23.378 | 10168.797 |
| nntp read | 00:01:30.319 | 0.1% | 3625066 | 0.000 | 0.025 | 0.063 |
| overview write | 00:00:12.625 | 0.0% | 43787 | 0.109 | 0.288 | 3.318 |
| perl filter | 00:00:05.831 | 0.0% | 45659 | 0.000 | 0.128 | 0.252 |
| python filter | 00:13:30.597 | 0.9% | 45825 | 0.698 | 17.689 | 30.917 |
| site send | 00:00:01.214 | 0.0% | 43835 | 0.000 | 0.028 | 0.109 |
| TOTAL: 24:00:43.878 | 24:00:26.327 | 100.0% | - | - | - | - |
INNfeed timer:
| Code region | Time | Pct | Invoked | Min(ms) | Avg(ms) | Max(ms) |
|---|---|---|---|---|---|---|
| article new | 00:00:00.000 | 0.0% | 0 | 0.000 | 0.000 | 0.000 |
| article prepare | 00:00:00.000 | 0.0% | 0 | 0.000 | 0.000 | 0.000 |
| article read | 00:00:00.000 | 0.0% | 0 | 0.000 | 0.000 | 0.000 |
| backlog stats | 00:00:00.001 | 0.0% | 3731 | 0.000 | 0.000 | 0.038 |
| callbacks | 00:00:00.000 | 0.0% | 0 | 0.000 | 0.000 | 0.000 |
| data read | 00:00:00.000 | 0.0% | 3 | 0.000 | 0.000 | 0.000 |
| data write | 00:00:00.000 | 0.0% | 3 | 0.000 | 0.000 | 0.000 |
| idle | 23:56:10.334 | 100.0% | 3731 | 17658.559 | 23095.774 | 24107.360 |
| status file | 00:00:00.000 | 0.0% | 6 | 0.000 | 0.000 | 0.000 |
| TOTAL: 23:56:10.376 | 23:56:10.335 | 100.0% | - | - | - | - |
nnrpd timer:
| Code region | Time | Pct | Invoked | Min(ms) | Avg(ms) | Max(ms) |
|---|---|---|---|---|---|---|
| hisgrep | 00:00:01.993 | 0.0% | 5248 | 0.000 | 0.380 | 4.375 |
| idle | 00:00:00.000 | 0.0% | 0 | 0.000 | 0.000 | 0.000 |
| newnews | 00:00:00.000 | 0.0% | 0 | 0.000 | 0.000 | 0.000 |
| nntpwrite | 00:24:56.692 | 1.4% | 13287670 | 0.000 | 0.113 | 82.889 |
| readart | 00:00:09.436 | 0.0% | 5375 | 0.000 | 1.756 | 45.000 |
| TOTAL: 30:46:18.957 | 00:25:08.121 | 1.4% | - | - | - | - |
Control commands to INND:
| Command | Number |
|---|---|
| flush | 5 |
| flushlogs | 2 |
| go | 1 |
| logmode | 2 |
| mode | 149 |
| name | 2 |
| pause | 1 |
| paused | 1 |
| reload | 2 |
| renumber | 1 |
| TOTAL: 10 | 166 |
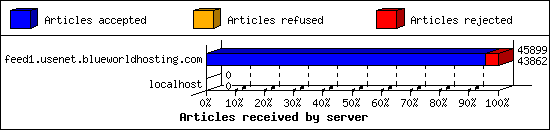
Incoming Feeds (INN):
| Server | Connects | Offered | Taken | Refused | Reject | %Accpt | Elapsed | |
|---|---|---|---|---|---|---|---|---|
| 1 | feed1.usenet.blueworldhosting.com | 23 | 45899 | 43862 | 0 | 2037 | 95% | 25:49:26 |
| 2 | localhost | 2 | 0 | 0 | 0 | 0 | 0% | 00:00:00 |
| TOTAL: 2 | 25 | 45899 | 43862 | 0 | 2037 | 95% | 25:49:26 | |
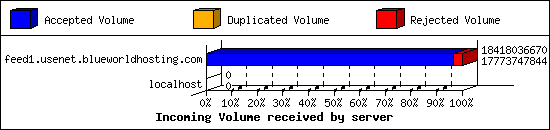
Incoming Volume (INN):
| Server | AcceptVol | DupVol | RejVol | TotalVol | %Acc | Vol/Art | |
|---|---|---|---|---|---|---|---|
| 1 | feed1.usenet.blueworldhosting.com | 16.6 GB | 0.0 KB | 614.4 MB | 17.2 GB | 96% | 391.9 KB |
| 2 | localhost | 0.0 KB | 0.0 KB | 0.0 KB | 0.0 KB | 0% | 0 |
| TOTAL: 2 | 16.6 GB | 0.0 KB | 614.4 MB | 17.2 GB | 96% | 391.9 KB | |
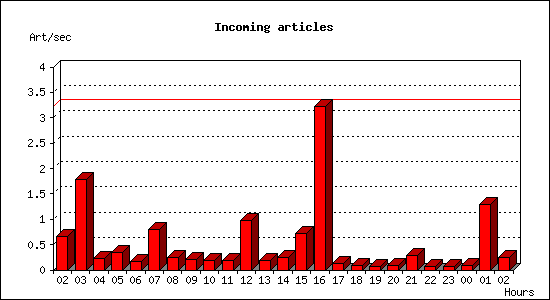
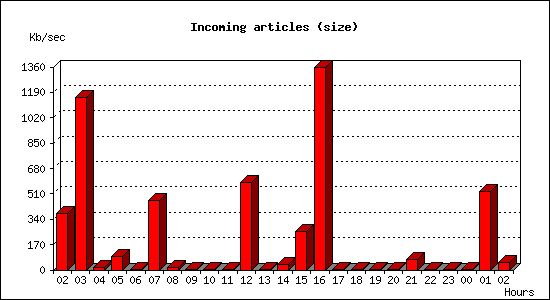
Incoming articles:
| Date | Articles | %Arts | Art/sec | Size | %Size | KB/sec |
|---|---|---|---|---|---|---|
| Aug 24 02:30:00 - 02:59:59 | 1200 | 2.7% | 0.67 | 666.0 MB | 3.9% | 378.86 |
| Aug 24 03:00:00 - 03:59:59 | 6450 | 14.7% | 1.79 | 4.0 GB | 24.1% | 1156.00 |
| Aug 24 04:00:00 - 04:59:59 | 806 | 1.8% | 0.22 | 64.3 MB | 0.4% | 18.30 |
| Aug 24 05:00:00 - 05:59:59 | 1236 | 2.8% | 0.34 | 326.6 MB | 1.9% | 92.89 |
| Aug 24 06:00:00 - 06:59:59 | 629 | 1.4% | 0.17 | 3.2 MB | 0.0% | 0.91 |
| Aug 24 07:00:00 - 07:59:59 | 2888 | 6.6% | 0.80 | 1.6 GB | 9.6% | 462.87 |
| Aug 24 08:00:00 - 08:59:59 | 909 | 2.1% | 0.25 | 62.9 MB | 0.4% | 17.88 |
| Aug 24 09:00:00 - 09:59:59 | 740 | 1.7% | 0.21 | 8.8 MB | 0.1% | 2.51 |
| Aug 24 10:00:00 - 10:59:59 | 702 | 1.6% | 0.20 | 3.0 MB | 0.0% | 0.85 |
| Aug 24 11:00:00 - 11:59:59 | 690 | 1.6% | 0.19 | 4.5 MB | 0.0% | 1.27 |
| Aug 24 12:00:00 - 12:59:59 | 3477 | 7.9% | 0.97 | 2.0 GB | 12.2% | 585.48 |
| Aug 24 13:00:00 - 13:59:59 | 690 | 1.6% | 0.19 | 3.2 MB | 0.0% | 0.90 |
| Aug 24 14:00:00 - 14:59:59 | 878 | 2.0% | 0.24 | 124.5 MB | 0.7% | 35.40 |
| Aug 24 15:00:00 - 15:59:59 | 2590 | 5.9% | 0.72 | 916.4 MB | 5.4% | 260.67 |
| Aug 24 16:00:00 - 16:59:59 | 11578 | 26.5% | 3.22 | 4.7 GB | 28.3% | 1359.02 |
| Aug 24 17:00:00 - 17:59:59 | 486 | 1.1% | 0.14 | 4.2 MB | 0.0% | 1.19 |
| Aug 24 18:00:00 - 18:59:59 | 303 | 0.7% | 0.08 | 1.1 MB | 0.0% | 0.32 |
| Aug 24 19:00:00 - 19:59:59 | 236 | 0.5% | 0.07 | 815.2 KB | 0.0% | 0.23 |
| Aug 24 20:00:00 - 20:59:59 | 293 | 0.7% | 0.08 | 943.5 KB | 0.0% | 0.26 |
| Aug 24 21:00:00 - 21:59:59 | 1055 | 2.4% | 0.29 | 247.6 MB | 1.5% | 70.43 |
| Aug 24 22:00:00 - 22:59:59 | 254 | 0.6% | 0.07 | 4.1 MB | 0.0% | 1.16 |
| Aug 24 23:00:00 - 23:59:59 | 254 | 0.6% | 0.07 | 1.3 MB | 0.0% | 0.36 |
| Aug 25 00:00:00 - 00:59:59 | 337 | 0.8% | 0.09 | 1.2 MB | 0.0% | 0.35 |
| Aug 25 01:00:00 - 01:59:59 | 4626 | 10.6% | 1.28 | 1.8 GB | 10.9% | 522.68 |
| Aug 25 02:00:00 - 02:30:00 | 433 | 1.0% | 0.24 | 86.2 MB | 0.5% | 49.05 |
| TOTAL: 24:00:00 | 43740 | 100.0% | 0.51 | 16.5 GB | 100.0% | 200.25 |
Sites sending bad articles:
| Server | Total | Group | Dist | Duplic | Unapp | TooOld | Site | Line | Other | |
|---|---|---|---|---|---|---|---|---|---|---|
| 1 | feed1.usenet.blueworldhosting.com | 2337 | 1870 | 0 | 0 | 1 | 0 | 0 | 0 | 466 |
| TOTAL: 1 | 2337 | 1870 | 0 | 0 | 1 | 0 | 0 | 0 | 466 | |
Unwanted newsgroups [Top 20]:
| Newsgroup | Count |
|---|---|
| alt.binaries.e-books.flood | 982 |
| talk.ukrainian.tg | 380 |
| al.binaries.test | 256 |
| talk.english.tg | 60 |
| finet.binaries.keskustelu | 14 |
| alt.binaries.pictures.scenic | 12 |
| alt.binaries.pictures.nude.celebrities.fake | 11 |
| alt.binaries.nospam.female.bodyhair | 11 |
| man.politics | 10 |
| alt.binaries.nospam.female.bodyhair.pubes | 10 |
| talk.generic.ua.ws | 10 |
| alt.binaries.pictures.wallpaper | 9 |
| alt.binaries.sounds.mp3.disco | 8 |
| talk.english.tw | 8 |
| alt.binaries.pictures.teen-starlets | 7 |
| alt.binaries.comics.dcp | 6 |
| alt.binaries.boneless | 5 |
| alt.binaries.test.yenc | 4 |
| alt.binaries.sounds.lossless.24bit | 3 |
| alt.binaries.pictures.earlmiller | 3 |
| TOTAL: 62 | 1870 |
Supposedly-moderated groups with unmoderated postings [Top 20]:
| Groups | Count |
|---|---|
| bit.listserv.catholic | 1 |
| TOTAL: 1 | 1 |
INND Python filter [Top 20]:
| Reason | Count |
|---|---|
| EMP Body Reject | 128 |
| Bad Subject (Solution manual ) | 18 |
| Bad Subject (Solution Manual ) | 14 |
| Bad From (FBInCIAnNSATerroristSlayer@yahoo.com) | 5 |
| Bad Subject (Buy Adderall) | 1 |
| TOTAL: 5 | 166 |
NoCeM on Spool:
| Id | Good | Bad | Unique | Total |
|---|---|---|---|---|
| bleachbot@httrack.com | 4 | 0 | 4 | 4 |
| TOTAL: 1 | 4 | 0 | 4 | 4 |
Miscellaneous innd statistics [Top 10]:
| Event | Server | Number |
|---|---|---|
| Including strange strings | ||
| feed1.usenet.blueworldhosting.com | 300 | |
| TOTAL: 1 | 300 | |
| TOTAL: 1 | 300 | |
Outgoing Feeds (innfeed) by Articles:
| Server | Offered | Taken | Refused | Reject | Miss | Spool | %Took | Elapsed | |
|---|---|---|---|---|---|---|---|---|---|
| 1 | feed1.usenet.blueworldhosting.com | 0 | 0 | 0 | 0 | 0 | 0 | 0% | 00:10:00 |
| TOTAL: 1 | 0 | 0 | 0 | 0 | 0 | 0 | 0% | 00:10:00 | |
Outgoing Feeds (innfeed) by Volume:
| Server | AcceptVol | RejectVol | TotalVol | Volume/sec | Vol/Art | Elapsed | |
|---|---|---|---|---|---|---|---|
| 1 | feed1.usenet.blueworldhosting.com | 0.0 KB | 0.0 KB | 0.0 KB | 0.0 KB/s | 0 | 00:10:00 |
| TOTAL: 1 | 0.0 KB | 0.0 KB | 0.0 KB | 0.0 KB/s | 0 | 00:10:00 | |
NNRP readership statistics:
| System | Conn | Arts | Size | Groups | Post | Rej | Elapsed | |
|---|---|---|---|---|---|---|---|---|
| 1 | 173.30.87.242 | 10 | 127 | 278.8 KB | 13 | 0 | 0 | 00:07:34 |
| 2 | 023-084-030-207.res.spectrum.com | 569 | 36 | 81.3 KB | 5 | 0 | 0 | 05:21:36 |
| 3 | 209.160.112.216 | 20 | 0 | 0.0 KB | 0 | 5210 | 0 | 02:52:28 |
| TOTAL: 3 | 599 | 163 | 360.1 KB | 18 | 5210 | 0 | 30:46:10 | |
NNRP readership statistics (by domain):
| System | Conn | Arts | Size | Groups | Post | Rej | Elapsed | |
|---|---|---|---|---|---|---|---|---|
| 1 | unresolved | 31 | 127 | 278.8 KB | 13 | 5210 | 0 | 03:00:05 |
| 2 | *.res.spectrum.com | 569 | 36 | 81.3 KB | 5 | 0 | 0 | 05:21:36 |
| 3 | *.stehlik.co.uk | 933 | 0 | 0.0 KB | 0 | 0 | 0 | 22:24:28 |
| TOTAL: 3 | 1533 | 163 | 360.1 KB | 18 | 5210 | 0 | 30:46:10 | |
NNRP auth users [Top 20]:
| User | Conn |
|---|---|
| jesse | 589 |
| TOTAL: 1 | 589 |
NNRP total resource statistics [Top 20]:
| System | User(ms) | System(ms) | Idle(ms) | Elapsed |
|---|---|---|---|---|
| toma-03.stehlik.co.uk | 182.094 | 60.719 | 0.000 | 22:24:28 |
| 023-084-030-207.res.spectrum.com | 43.251 | 6.930 | 2.987 | 05:21:36 |
| 209.160.112.216 | 125.157 | 106.455 | 0.097 | 02:52:28 |
| 173.30.87.242 | 1.033 | 0.172 | 0.000 | 00:07:34 |
| 92.255.85.183 | 0.059 | 0.017 | 0.000 | 00:00:03 |
| TOTAL: 5 | 351.594 | 174.293 | 3.084 | 30:46:10 |
Curious NNRP server explorers [Top 20]:
| System | Conn |
|---|---|
| toma-03.stehlik.co.uk | 933 |
| 92.255.85.183 | 1 |
| TOTAL: 2 | 934 |
NNRP client timeouts [Top 20]:
| System | Conn | Peer |
|---|---|---|
| 023-084-030-207.res.spectrum.com | 569 | 569 |
| TOTAL: 1 | 569 | 569 |
Newsgroup request counts (by hierarchy):
| Hierarchy | Count | Pct | |
|---|---|---|---|
| 1 | rec | 127 | 88.8% |
| 2 | free | 11 | 7.7% |
| 3 | alt | 5 | 3.5% |
| TOTAL: 3 | 143 | 100.0% | |
Newsgroup request counts (by newsgroup) [Top 100]:
| Newsgroup | Count | |
|---|---|---|
| 1 | rec.food.cooking | 127 |
| 2 | free.usenet | 10 |
| 3 | alt.security.pgp | 5 |
| 4 | free.pt | 1 |
| TOTAL: 4 | 143 | |