Log entries by program:
| Program name | Lines | %Lines | Size | %Size |
|---|---|---|---|---|
| inn | 2497508 | 89.4% | 215.0 MB | 87.6% |
| innd | 232712 | 8.3% | 24.1 MB | 9.8% |
| nnrpd | 63028 | 2.3% | 6.4 MB | 2.6% |
| innfeed | 157 | 0.0% | 16.3 KB | 0.0% |
| nocem | 5 | 0.0% | 0.4 KB | 0.0% |
| controlchan | 1 | 0.0% | 0.1 KB | 0.0% |
| TOTAL: 6 | 2793411 | 100.0% | 245.6 MB | 100.0% |
History cache:
| Reason | Count | %Count |
|---|---|---|
| Do not exist | 2478251 | 50.1% |
| Negative hits | 2465085 | 49.9% |
| Cache misses | 633 | 0.0% |
| Positive hits | 73 | 0.0% |
| TOTAL: 4 | 4944042 | 100.0% |
INND timer:
| Code region | Time | Pct | Invoked | Min(ms) | Avg(ms) | Max(ms) |
|---|---|---|---|---|---|---|
| article cancel | 00:00:01.488 | 0.0% | 326 | 0.000 | 4.564 | 47.000 |
| article cleanup | 00:00:12.585 | 0.0% | 2484898 | 0.000 | 0.005 | 0.036 |
| article logging | 00:00:26.708 | 0.0% | 2494534 | 0.000 | 0.011 | 0.028 |
| article parse | 00:02:12.906 | 0.2% | 12947909 | 0.000 | 0.010 | 0.033 |
| article write | 00:42:45.936 | 3.0% | 2351775 | 0.250 | 1.091 | 11.960 |
| artlog/artcncl | 00:00:00.000 | 0.0% | 27 | 0.000 | 0.000 | 0.000 |
| artlog/artparse | 00:00:00.000 | 0.0% | 4 | 0.000 | 0.000 | 0.000 |
| data move | 00:00:11.992 | 0.0% | 8804304 | 0.000 | 0.001 | 0.003 |
| hisgrep/artcncl | 00:00:00.218 | 0.0% | 353 | 0.000 | 0.618 | 7.000 |
| hishave/artcncl | 00:00:00.000 | 0.0% | 29 | 0.000 | 0.000 | 0.000 |
| history grep | 00:00:00.000 | 0.0% | 0 | 0.000 | 0.000 | 0.000 |
| history lookup | 00:05:32.882 | 0.4% | 4957364 | 0.044 | 0.067 | 0.866 |
| history sync | 00:00:02.126 | 0.0% | 320 | 0.000 | 6.644 | 8.500 |
| history write | 00:39:43.042 | 2.8% | 2484899 | 0.813 | 0.959 | 3.015 |
| hiswrite/artcncl | 00:00:00.000 | 0.0% | 0 | 0.000 | 0.000 | 0.000 |
| idle | 21:32:49.819 | 89.8% | 11364252 | 3.175 | 6.826 | 2288.550 |
| nntp read | 00:03:09.456 | 0.2% | 12976562 | 0.003 | 0.015 | 0.057 |
| overview write | 00:05:25.246 | 0.4% | 2351775 | 0.078 | 0.138 | 1.344 |
| perl filter | 00:01:11.657 | 0.1% | 2352900 | 0.014 | 0.030 | 0.069 |
| python filter | 00:40:23.669 | 2.8% | 4955214 | 0.198 | 0.489 | 3.025 |
| site send | 00:00:59.221 | 0.1% | 2351778 | 0.000 | 0.025 | 0.067 |
| TOTAL: 24:00:24.672 | 23:55:08.951 | 99.6% | - | - | - | - |
INNfeed timer:
| Code region | Time | Pct | Invoked | Min(ms) | Avg(ms) | Max(ms) |
|---|---|---|---|---|---|---|
| article new | 00:00:00.000 | 0.0% | 0 | 0.000 | 0.000 | 0.000 |
| article prepare | 00:00:00.000 | 0.0% | 0 | 0.000 | 0.000 | 0.000 |
| article read | 00:00:00.000 | 0.0% | 0 | 0.000 | 0.000 | 0.000 |
| backlog stats | 00:00:00.005 | 0.0% | 3726 | 0.000 | 0.001 | 0.038 |
| callbacks | 00:00:00.000 | 0.0% | 0 | 0.000 | 0.000 | 0.000 |
| data read | 00:00:00.000 | 0.0% | 3 | 0.000 | 0.000 | 0.000 |
| data write | 00:00:00.000 | 0.0% | 3 | 0.000 | 0.000 | 0.000 |
| idle | 23:50:13.411 | 100.0% | 3726 | 17448.629 | 23030.975 | 23332.963 |
| status file | 00:00:00.002 | 0.0% | 6 | 0.250 | 0.333 | 0.500 |
| TOTAL: 23:50:13.452 | 23:50:13.418 | 100.0% | - | - | - | - |
nnrpd timer:
| Code region | Time | Pct | Invoked | Min(ms) | Avg(ms) | Max(ms) |
|---|---|---|---|---|---|---|
| hisgrep | 00:00:00.198 | 0.0% | 7 | 3.250 | 28.286 | 61.667 |
| idle | 00:00:00.000 | 0.0% | 0 | 0.000 | 0.000 | 0.000 |
| newnews | 00:00:00.000 | 0.0% | 0 | 0.000 | 0.000 | 0.000 |
| nntpwrite | 00:20:43.423 | 1.5% | 13249614 | 0.000 | 0.094 | 113.364 |
| readart | 00:00:00.186 | 0.0% | 8 | 8.000 | 23.250 | 40.333 |
| TOTAL: 23:39:03.071 | 00:20:43.807 | 1.5% | - | - | - | - |
Control commands to INND:
| Command | Number |
|---|---|
| flush | 5 |
| flushlogs | 2 |
| go | 1 |
| logmode | 2 |
| lowmark | 2 |
| mode | 149 |
| name | 2 |
| pause | 1 |
| paused | 1 |
| reload | 2 |
| renumber | 1 |
| TOTAL: 11 | 168 |
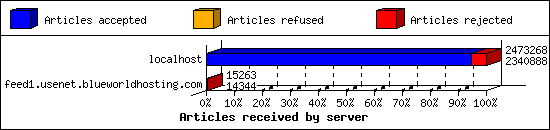
Incoming Feeds (INN):
| Server | Connects | Offered | Taken | Refused | Reject | %Accpt | Elapsed | |
|---|---|---|---|---|---|---|---|---|
| 1 | localhost | 24755 | 2473268 | 2340888 | 677 | 131703 | 94% | 31:13:08 |
| 2 | feed1.usenet.blueworldhosting.com | 10 | 15263 | 14344 | 0 | 919 | 93% | 24:39:58 |
| TOTAL: 2 | 24765 | 2488531 | 2355232 | 677 | 132622 | 94% | 55:53:06 | |
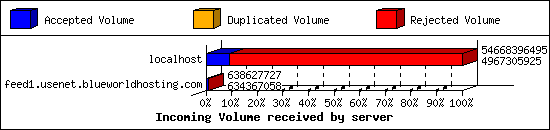
Incoming Volume (INN):
| Server | AcceptVol | DupVol | RejVol | TotalVol | %Acc | Vol/Art | |
|---|---|---|---|---|---|---|---|
| 1 | localhost | 4.6 GB | 0.0 KB | 46.3 GB | 50.9 GB | 9% | 21.6 KB |
| 2 | feed1.usenet.blueworldhosting.com | 605.0 MB | 0.0 KB | 4.1 MB | 609.0 MB | 99% | 40.9 KB |
| TOTAL: 2 | 5.2 GB | 0.0 KB | 46.3 GB | 51.5 GB | 10% | 21.7 KB | |
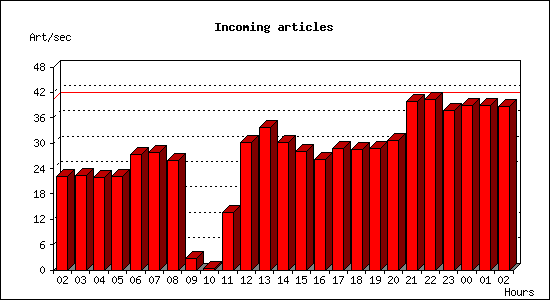
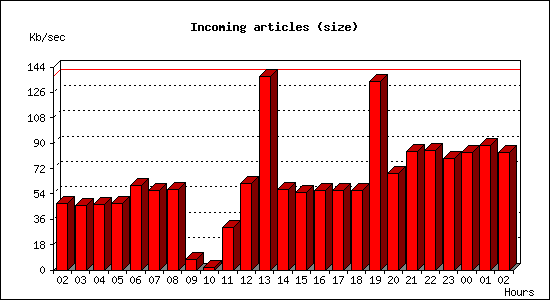
Incoming articles:
| Date | Articles | %Arts | Art/sec | Size | %Size | KB/sec |
|---|---|---|---|---|---|---|
| Aug 29 02:30:00 - 02:59:59 | 39764 | 1.7% | 22.09 | 82.7 MB | 1.5% | 47.04 |
| Aug 29 03:00:00 - 03:59:59 | 80276 | 3.4% | 22.30 | 161.2 MB | 3.0% | 45.86 |
| Aug 29 04:00:00 - 04:59:59 | 78608 | 3.3% | 21.84 | 163.4 MB | 3.1% | 46.46 |
| Aug 29 05:00:00 - 05:59:59 | 79350 | 3.4% | 22.04 | 166.9 MB | 3.1% | 47.47 |
| Aug 29 06:00:00 - 06:59:59 | 98337 | 4.2% | 27.32 | 210.4 MB | 3.9% | 59.84 |
| Aug 29 07:00:00 - 07:59:59 | 99702 | 4.2% | 27.70 | 198.6 MB | 3.7% | 56.49 |
| Aug 29 08:00:00 - 08:59:59 | 93118 | 4.0% | 25.87 | 201.0 MB | 3.8% | 57.18 |
| Aug 29 09:00:00 - 09:59:59 | 9887 | 0.4% | 2.75 | 25.4 MB | 0.5% | 7.21 |
| Aug 29 10:00:00 - 10:59:59 | 859 | 0.0% | 0.24 | 7.2 MB | 0.1% | 2.05 |
| Aug 29 11:00:00 - 11:59:59 | 48713 | 2.1% | 13.53 | 105.7 MB | 2.0% | 30.06 |
| Aug 29 12:00:00 - 12:59:59 | 108234 | 4.6% | 30.07 | 216.0 MB | 4.0% | 61.44 |
| Aug 29 13:00:00 - 13:59:59 | 121417 | 5.2% | 33.73 | 482.5 MB | 9.0% | 137.25 |
| Aug 29 14:00:00 - 14:59:59 | 108630 | 4.6% | 30.18 | 200.4 MB | 3.8% | 57.01 |
| Aug 29 15:00:00 - 15:59:59 | 100958 | 4.3% | 28.04 | 193.0 MB | 3.6% | 54.90 |
| Aug 29 16:00:00 - 16:59:59 | 94171 | 4.0% | 26.16 | 197.7 MB | 3.7% | 56.23 |
| Aug 29 17:00:00 - 17:59:59 | 103325 | 4.4% | 28.70 | 199.1 MB | 3.7% | 56.64 |
| Aug 29 18:00:00 - 18:59:59 | 102560 | 4.4% | 28.49 | 198.9 MB | 3.7% | 56.56 |
| Aug 29 19:00:00 - 19:59:59 | 103587 | 4.4% | 28.77 | 470.4 MB | 8.8% | 133.81 |
| Aug 29 20:00:00 - 20:59:59 | 110257 | 4.7% | 30.63 | 240.7 MB | 4.5% | 68.48 |
| Aug 29 21:00:00 - 21:59:59 | 143448 | 6.1% | 39.85 | 294.6 MB | 5.5% | 83.79 |
| Aug 29 22:00:00 - 22:59:59 | 144885 | 6.2% | 40.25 | 297.6 MB | 5.6% | 84.65 |
| Aug 29 23:00:00 - 23:59:59 | 135394 | 5.7% | 37.61 | 278.0 MB | 5.2% | 79.08 |
| Aug 30 00:00:00 - 00:59:59 | 140175 | 6.0% | 38.94 | 291.8 MB | 5.5% | 83.02 |
| Aug 30 01:00:00 - 01:59:59 | 139933 | 5.9% | 38.87 | 309.6 MB | 5.8% | 88.07 |
| Aug 30 02:00:00 - 02:30:00 | 69642 | 3.0% | 38.69 | 146.1 MB | 2.7% | 83.09 |
| TOTAL: 24:00:00 | 2355230 | 100.0% | 27.26 | 5.2 GB | 100.0% | 63.28 |
Sites sending bad articles:
| Server | Total | Group | Dist | Duplic | Unapp | TooOld | Site | Line | Other | |
|---|---|---|---|---|---|---|---|---|---|---|
| 1 | localhost | 140948 | 0 | 5 | 0 | 243 | 0 | 0 | 0 | 140700 |
| 2 | feed1.usenet.blueworldhosting.com | 1303 | 876 | 0 | 0 | 1 | 0 | 0 | 0 | 426 |
| TOTAL: 2 | 142251 | 876 | 5 | 0 | 244 | 0 | 0 | 0 | 141126 | |
Unwanted newsgroups [Top 20]:
| Newsgroup | Count |
|---|---|
| talk.ukrainian.tg | 389 |
| al.binaries.test | 252 |
| talk.english.tg | 56 |
| panix.chat | 13 |
| talk.generic.ua.ws | 13 |
| alt.binaries.pictures.scenic | 11 |
| alt.binaries.pictures.nude.celebrities.fake | 8 |
| finet.binaries.keskustelu | 7 |
| news.oriens-occasus.ru | 6 |
| alt.binaries.pictures.wallpaper | 6 |
| alt.binaries.nospam.female.bodyhair | 5 |
| alt.binaries.test.yenc | 4 |
| alt.binaries.pictures.teen-starlets | 4 |
| alt.binaries.pictures.tall-ships | 4 |
| alt.binaries.pictures.nude | 3 |
| alt.binaries.pictures.sierra | 3 |
| alt.binaries.sacd.iso | 3 |
| alt.binaries.sounds.mp3.1960s | 3 |
| wolfsburg.test | 3 |
| alt.binaries.images.fun | 3 |
| TOTAL: 80 | 876 |
Unwanted distributions [Top 20]:
| Distribution | Count |
|---|---|
| local | 5 |
| TOTAL: 1 | 5 |
Supposedly-moderated groups with unmoderated postings [Top 20]:
| Groups | Count |
|---|---|
| rec.guns | 214 |
| it.scienza.astronomia | 14 |
| alt.music.sultans-of-ping | 5 |
| clari.news.photos | 5 |
| rec.games.roguelike.announce | 2 |
| fido7.ru.machine.embroidery | 1 |
| rec.gardens.ecosystems | 1 |
| kw.forsale | 1 |
| bit.listserv.catholic | 1 |
| TOTAL: 9 | 244 |
INND Python filter [Top 20]:
| Reason | Count |
|---|---|
| Binary (yEnc) | 125084 |
| EMP Body Reject | 3255 |
| Bad From (MI5Victim@mi5.gov.uk) | 1941 |
| Binary (uuEnc) | 363 |
| Bad From (hclaudioblanco@gmail.com) | 246 |
| Bad From (fudotrick1@gmail.com) | 101 |
| Bad From (giressfrank1@gmail.com) | 81 |
| Binary (base64) | 62 |
| Bad From (hester holt) | 51 |
| Bad Subject (Solutions manual and Test banks) | 46 |
| Crosspost Low Limit Exceeded | 35 |
| Bad From (huhai102@gmail.com) | 34 |
| Bad From (FBInCIAnNSATerroristSlayer@yahoo.com) | 33 |
| Bad Subject (Solution Manual ) | 18 |
| Bad Subject (Solution manual ) | 16 |
| Bad Subject (Buy Xanax) | 14 |
| OS2 Followup | 11 |
| Bad From (huhai1001@gmail.com) | 11 |
| Bad From (ftony3720@gmail.com) | 10 |
| AUK Bad Crosspost | 9 |
| TOTAL: 41 | 131474 |
NoCeM on Spool:
| Id | Good | Bad | Unique | Total |
|---|---|---|---|---|
| bleachbot@httrack.com | 2 | 0 | 2 | 2 |
| TOTAL: 1 | 2 | 0 | 2 | 2 |
Miscellaneous innd statistics [Top 10]:
| Event | Server | Number |
|---|---|---|
| Bad Message-ID's offered | ||
| localhost | 1177 | |
| TOTAL: 1 | 1177 | |
| Including strange strings | ||
| localhost | 9245 | |
| feed1.usenet.blueworldhosting.com | 389 | |
| TOTAL: 2 | 9634 | |
| TOTAL: 2 | 10811 | |
Outgoing Feeds (innfeed) by Articles:
| Server | Offered | Taken | Refused | Reject | Miss | Spool | %Took | Elapsed | |
|---|---|---|---|---|---|---|---|---|---|
| 1 | feed1.usenet.blueworldhosting.com | 0 | 0 | 0 | 0 | 0 | 0 | 0% | 00:10:00 |
| TOTAL: 1 | 0 | 0 | 0 | 0 | 0 | 0 | 0% | 00:10:00 | |
Outgoing Feeds (innfeed) by Volume:
| Server | AcceptVol | RejectVol | TotalVol | Volume/sec | Vol/Art | Elapsed | |
|---|---|---|---|---|---|---|---|
| 1 | feed1.usenet.blueworldhosting.com | 0.0 KB | 0.0 KB | 0.0 KB | 0.0 KB/s | 0 | 00:10:00 |
| TOTAL: 1 | 0.0 KB | 0.0 KB | 0.0 KB | 0.0 KB/s | 0 | 00:10:00 | |
NNRP readership statistics:
| System | Conn | Arts | Size | Groups | Post | Rej | Elapsed | |
|---|---|---|---|---|---|---|---|---|
| 1 | 208.91.71.152 | 122 | 8 | 1.4 MB | 1 | 0 | 0 | 01:12:28 |
| TOTAL: 1 | 122 | 8 | 1.4 MB | 1 | 0 | 0 | 23:38:57 | |
NNRP readership statistics (by domain):
| System | Conn | Arts | Size | Groups | Post | Rej | Elapsed | |
|---|---|---|---|---|---|---|---|---|
| 1 | unresolved | 122 | 8 | 1.4 MB | 1 | 0 | 0 | 01:12:28 |
| 2 | *.stehlik.co.uk | 897 | 0 | 0.0 KB | 0 | 0 | 0 | 22:26:29 |
| TOTAL: 2 | 1019 | 8 | 1.4 MB | 1 | 0 | 0 | 23:38:57 | |
NNRP auth users [Top 20]:
| User | Conn |
|---|---|
| jesse | 122 |
| TOTAL: 1 | 122 |
NNRP total resource statistics [Top 20]:
| System | User(ms) | System(ms) | Idle(ms) | Elapsed |
|---|---|---|---|---|
| toma-03.stehlik.co.uk | 179.408 | 60.494 | 0.000 | 22:26:29 |
| 208.91.71.152 | 9.920 | 1.530 | 0.767 | 01:12:28 |
| TOTAL: 2 | 189.328 | 62.024 | 0.767 | 23:38:57 |
Curious NNRP server explorers [Top 20]:
| System | Conn |
|---|---|
| toma-03.stehlik.co.uk | 897 |
| TOTAL: 1 | 897 |
NNRP client timeouts [Top 20]:
| System | Conn | Peer |
|---|---|---|
| 208.91.71.152 | 122 | 122 |
| TOTAL: 1 | 122 | 122 |
Newsgroup request counts (by hierarchy):
| Hierarchy | Count | Pct | |
|---|---|---|---|
| 1 | free | 1 | 100.0% |
| TOTAL: 1 | 1 | 100.0% | |
Newsgroup request counts (by newsgroup) [Top 100]:
| Newsgroup | Count | |
|---|---|---|
| 1 | free.usenet | 1 |
| TOTAL: 1 | 1 | |