Log entries by program:
| Program name | Lines | %Lines | Size | %Size |
|---|---|---|---|---|
| nnrpd | 78066 | 58.1% | 7.1 MB | 52.7% |
| inn | 54986 | 40.9% | 6.2 MB | 45.9% |
| innd | 1232 | 0.9% | 177.6 KB | 1.3% |
| innfeed | 157 | 0.1% | 14.4 KB | 0.1% |
| nocem | 24 | 0.0% | 2.1 KB | 0.0% |
| controlchan | 1 | 0.0% | 0.0 KB | 0.0% |
| TOTAL: 6 | 134466 | 100.0% | 13.5 MB | 100.0% |
History cache:
| Reason | Count | %Count |
|---|---|---|
| Do not exist | 54568 | 96.2% |
| Negative hits | 2129 | 3.8% |
| Positive hits | 21 | 0.0% |
| Cache misses | 3 | 0.0% |
| TOTAL: 4 | 56721 | 100.0% |
INND timer:
| Code region | Time | Pct | Invoked | Min(ms) | Avg(ms) | Max(ms) |
|---|---|---|---|---|---|---|
| article cancel | 00:00:00.400 | 0.0% | 107 | 0.000 | 3.738 | 38.000 |
| article cleanup | 00:00:00.482 | 0.0% | 54607 | 0.000 | 0.009 | 0.030 |
| article logging | 00:00:00.815 | 0.0% | 54981 | 0.000 | 0.015 | 0.077 |
| article parse | 00:00:45.788 | 0.1% | 4567356 | 0.000 | 0.010 | 0.041 |
| article write | 00:16:58.026 | 1.2% | 53718 | 2.660 | 18.951 | 35.514 |
| artlog/artcncl | 00:00:00.000 | 0.0% | 15 | 0.000 | 0.000 | 0.000 |
| artlog/artparse | 00:00:00.000 | 0.0% | 0 | 0.000 | 0.000 | 0.000 |
| data move | 00:00:04.008 | 0.0% | 4936587 | 0.000 | 0.001 | 0.010 |
| hisgrep/artcncl | 00:00:00.109 | 0.0% | 120 | 0.000 | 0.908 | 17.000 |
| hishave/artcncl | 00:00:00.001 | 0.0% | 25 | 0.000 | 0.040 | 1.000 |
| history grep | 00:00:00.000 | 0.0% | 0 | 0.000 | 0.000 | 0.000 |
| history lookup | 00:00:11.685 | 0.0% | 56736 | 0.094 | 0.206 | 0.386 |
| history sync | 00:00:01.439 | 0.0% | 321 | 0.000 | 4.483 | 9.500 |
| history write | 00:00:37.695 | 0.0% | 54607 | 0.466 | 0.690 | 1.162 |
| hiswrite/artcncl | 00:00:00.003 | 0.0% | 1 | 3.000 | 3.000 | 3.000 |
| idle | 23:23:34.556 | 97.4% | 4562924 | 0.745 | 18.456 | 8215.630 |
| nntp read | 00:01:36.122 | 0.1% | 4562713 | 0.000 | 0.021 | 0.053 |
| overview write | 00:00:15.369 | 0.0% | 53718 | 0.104 | 0.286 | 3.850 |
| perl filter | 00:00:07.091 | 0.0% | 54586 | 0.000 | 0.130 | 0.239 |
| python filter | 00:15:58.737 | 1.1% | 54607 | 0.721 | 17.557 | 29.781 |
| site send | 00:00:01.628 | 0.0% | 53785 | 0.000 | 0.030 | 0.087 |
| TOTAL: 24:00:38.896 | 24:00:13.954 | 100.0% | - | - | - | - |
INNfeed timer:
| Code region | Time | Pct | Invoked | Min(ms) | Avg(ms) | Max(ms) |
|---|---|---|---|---|---|---|
| article new | 00:00:00.000 | 0.0% | 0 | 0.000 | 0.000 | 0.000 |
| article prepare | 00:00:00.000 | 0.0% | 0 | 0.000 | 0.000 | 0.000 |
| article read | 00:00:00.000 | 0.0% | 0 | 0.000 | 0.000 | 0.000 |
| backlog stats | 00:00:00.006 | 0.0% | 3731 | 0.000 | 0.002 | 0.038 |
| callbacks | 00:00:00.000 | 0.0% | 0 | 0.000 | 0.000 | 0.000 |
| data read | 00:00:00.000 | 0.0% | 3 | 0.000 | 0.000 | 0.000 |
| data write | 00:00:00.000 | 0.0% | 3 | 0.000 | 0.000 | 0.000 |
| idle | 23:56:26.619 | 100.0% | 3731 | 17380.343 | 23100.139 | 25097.833 |
| status file | 00:00:00.001 | 0.0% | 6 | 0.000 | 0.167 | 0.500 |
| TOTAL: 23:56:26.664 | 23:56:26.626 | 100.0% | - | - | - | - |
nnrpd timer:
| Code region | Time | Pct | Invoked | Min(ms) | Avg(ms) | Max(ms) |
|---|---|---|---|---|---|---|
| hisgrep | 00:00:02.363 | 0.0% | 5885 | 0.000 | 0.402 | 7.000 |
| idle | 00:00:00.000 | 0.0% | 0 | 0.000 | 0.000 | 0.000 |
| newnews | 00:00:00.000 | 0.0% | 0 | 0.000 | 0.000 | 0.000 |
| nntpwrite | 00:22:52.249 | 1.2% | 13314371 | 0.000 | 0.103 | 79.647 |
| readart | 00:00:11.064 | 0.0% | 6161 | 0.000 | 1.796 | 34.000 |
| TOTAL: 30:53:02.138 | 00:23:05.676 | 1.2% | - | - | - | - |
Control commands to INND:
| Command | Number |
|---|---|
| flush | 5 |
| flushlogs | 2 |
| go | 1 |
| logmode | 2 |
| mode | 149 |
| name | 2 |
| pause | 1 |
| paused | 1 |
| reload | 2 |
| renumber | 1 |
| TOTAL: 10 | 166 |
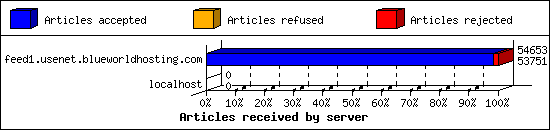
Incoming Feeds (INN):
| Server | Connects | Offered | Taken | Refused | Reject | %Accpt | Elapsed | |
|---|---|---|---|---|---|---|---|---|
| 1 | feed1.usenet.blueworldhosting.com | 19 | 54653 | 53751 | 0 | 902 | 98% | 26:01:43 |
| 2 | localhost | 2 | 0 | 0 | 0 | 0 | 0% | 00:00:00 |
| TOTAL: 2 | 21 | 54653 | 53751 | 0 | 902 | 98% | 26:01:43 | |
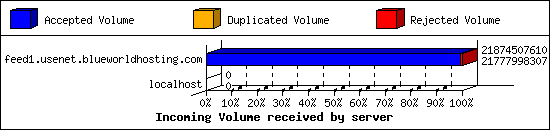
Incoming Volume (INN):
| Server | AcceptVol | DupVol | RejVol | TotalVol | %Acc | Vol/Art | |
|---|---|---|---|---|---|---|---|
| 1 | feed1.usenet.blueworldhosting.com | 20.3 GB | 0.0 KB | 92.0 MB | 20.4 GB | 99% | 390.9 KB |
| 2 | localhost | 0.0 KB | 0.0 KB | 0.0 KB | 0.0 KB | 0% | 0 |
| TOTAL: 2 | 20.3 GB | 0.0 KB | 92.0 MB | 20.4 GB | 99% | 390.9 KB | |
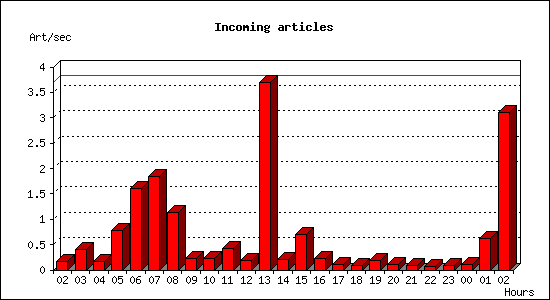
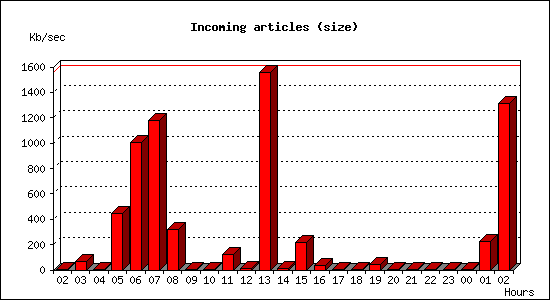
Incoming articles:
| Date | Articles | %Arts | Art/sec | Size | %Size | KB/sec |
|---|---|---|---|---|---|---|
| Sep 14 02:30:00 - 02:59:59 | 306 | 0.6% | 0.17 | 1.7 MB | 0.0% | 0.95 |
| Sep 14 03:00:00 - 03:59:59 | 1426 | 2.7% | 0.40 | 235.0 MB | 1.1% | 66.85 |
| Sep 14 04:00:00 - 04:59:59 | 620 | 1.2% | 0.17 | 1.8 MB | 0.0% | 0.52 |
| Sep 14 05:00:00 - 05:59:59 | 2787 | 5.2% | 0.77 | 1.5 GB | 7.6% | 446.96 |
| Sep 14 06:00:00 - 06:59:59 | 5773 | 10.7% | 1.60 | 3.5 GB | 17.0% | 1006.14 |
| Sep 14 07:00:00 - 07:59:59 | 6599 | 12.3% | 1.83 | 4.1 GB | 20.0% | 1180.62 |
| Sep 14 08:00:00 - 08:59:59 | 4076 | 7.6% | 1.13 | 1.1 GB | 5.4% | 320.02 |
| Sep 14 09:00:00 - 09:59:59 | 799 | 1.5% | 0.22 | 2.9 MB | 0.0% | 0.82 |
| Sep 14 10:00:00 - 10:59:59 | 823 | 1.5% | 0.23 | 2.7 MB | 0.0% | 0.76 |
| Sep 14 11:00:00 - 11:59:59 | 1502 | 2.8% | 0.42 | 429.0 MB | 2.1% | 122.02 |
| Sep 14 12:00:00 - 12:59:59 | 684 | 1.3% | 0.19 | 46.9 MB | 0.2% | 13.34 |
| Sep 14 13:00:00 - 13:59:59 | 13310 | 24.8% | 3.70 | 5.4 GB | 26.4% | 1558.82 |
| Sep 14 14:00:00 - 14:59:59 | 742 | 1.4% | 0.21 | 30.0 MB | 0.1% | 8.52 |
| Sep 14 15:00:00 - 15:59:59 | 2550 | 4.7% | 0.71 | 765.7 MB | 3.7% | 217.79 |
| Sep 14 16:00:00 - 16:59:59 | 819 | 1.5% | 0.23 | 121.0 MB | 0.6% | 34.41 |
| Sep 14 17:00:00 - 17:59:59 | 420 | 0.8% | 0.12 | 1.6 MB | 0.0% | 0.47 |
| Sep 14 18:00:00 - 18:59:59 | 354 | 0.7% | 0.10 | 2.2 MB | 0.0% | 0.63 |
| Sep 14 19:00:00 - 19:59:59 | 685 | 1.3% | 0.19 | 154.4 MB | 0.7% | 43.91 |
| Sep 14 20:00:00 - 20:59:59 | 359 | 0.7% | 0.10 | 4.8 MB | 0.0% | 1.37 |
| Sep 14 21:00:00 - 21:59:59 | 299 | 0.6% | 0.08 | 1.4 MB | 0.0% | 0.40 |
| Sep 14 22:00:00 - 22:59:59 | 230 | 0.4% | 0.06 | 2.0 MB | 0.0% | 0.56 |
| Sep 14 23:00:00 - 23:59:59 | 299 | 0.6% | 0.08 | 1.4 MB | 0.0% | 0.39 |
| Sep 15 00:00:00 - 00:59:59 | 398 | 0.7% | 0.11 | 4.2 MB | 0.0% | 1.19 |
| Sep 15 01:00:00 - 01:59:59 | 2246 | 4.2% | 0.62 | 787.9 MB | 3.8% | 224.12 |
| Sep 15 02:00:00 - 02:30:00 | 5600 | 10.4% | 3.11 | 2.3 GB | 11.1% | 1313.10 |
| TOTAL: 24:00:00 | 53706 | 100.0% | 0.62 | 20.3 GB | 100.0% | 246.15 |
Sites sending bad articles:
| Server | Total | Group | Dist | Duplic | Unapp | TooOld | Site | Line | Other | |
|---|---|---|---|---|---|---|---|---|---|---|
| 1 | feed1.usenet.blueworldhosting.com | 1265 | 867 | 0 | 0 | 1 | 0 | 0 | 0 | 397 |
| TOTAL: 1 | 1265 | 867 | 0 | 0 | 1 | 0 | 0 | 0 | 397 | |
Unwanted newsgroups [Top 20]:
| Newsgroup | Count |
|---|---|
| talk.ukrainian.tg | 257 |
| al.binaries.test | 195 |
| alt.binaries.ebooks.technical | 62 |
| alt.binaries.ebook.technical | 62 |
| alt.binaries.pictures.wallpaper | 58 |
| talk.english.tg | 54 |
| finet.binaries.keskustelu | 20 |
| alt.binaries.nospam.female.bodyhair.pubes | 20 |
| alt.binaries.pictures.nude.celebrities.fake | 12 |
| talk.generic.ua.ws | 9 |
| alt.binaries.howard-stern | 6 |
| alt.binaries.pictures.scenic | 6 |
| alt.binaries.test.yenc | 6 |
| alt.binaries.comp | 5 |
| talk.english.tw | 5 |
| alt.binaries.movies.erotica | 5 |
| alt.binaries.xxx | 5 |
| talk.from.diary | 3 |
| talk.from.war.diary | 3 |
| alt.binaries.images.fun | 3 |
| TOTAL: 69 | 867 |
Supposedly-moderated groups with unmoderated postings [Top 20]:
| Groups | Count |
|---|---|
| bit.listserv.catholic | 1 |
| TOTAL: 1 | 1 |
INND Python filter [Top 20]:
| Reason | Count |
|---|---|
| Bad From (FBInCIAnNSATerroristSlayer@yahoo.com) | 17 |
| Bad Subject (Solution manual ) | 2 |
| Bad Subject (Buy Adderall) | 1 |
| Bad Subject (Solution Manual ) | 1 |
| TOTAL: 4 | 21 |
NoCeM on Spool:
| Id | Good | Bad | Unique | Total |
|---|---|---|---|---|
| bleachbot@httrack.com | 11 | 0 | 11 | 11 |
| TOTAL: 1 | 11 | 0 | 11 | 11 |
Miscellaneous innd statistics [Top 10]:
| Event | Server | Number |
|---|---|---|
| Including strange strings | ||
| feed1.usenet.blueworldhosting.com | 376 | |
| TOTAL: 1 | 376 | |
| TOTAL: 1 | 376 | |
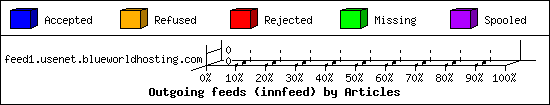
Outgoing Feeds (innfeed) by Articles:
| Server | Offered | Taken | Refused | Reject | Miss | Spool | %Took | Elapsed | |
|---|---|---|---|---|---|---|---|---|---|
| 1 | feed1.usenet.blueworldhosting.com | 0 | 0 | 0 | 0 | 0 | 0 | 0% | 00:10:00 |
| TOTAL: 1 | 0 | 0 | 0 | 0 | 0 | 0 | 0% | 00:10:00 | |
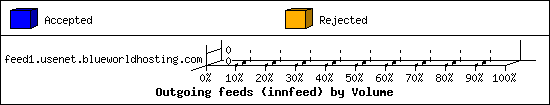
Outgoing Feeds (innfeed) by Volume:
| Server | AcceptVol | RejectVol | TotalVol | Volume/sec | Vol/Art | Elapsed | |
|---|---|---|---|---|---|---|---|
| 1 | feed1.usenet.blueworldhosting.com | 0.0 KB | 0.0 KB | 0.0 KB | 0.0 KB/s | 0 | 00:10:00 |
| TOTAL: 1 | 0.0 KB | 0.0 KB | 0.0 KB | 0.0 KB/s | 0 | 00:10:00 | |
NNRP readership statistics:
| System | Conn | Arts | Size | Groups | Post | Rej | Elapsed | |
|---|---|---|---|---|---|---|---|---|
| 1 | 173.30.87.242 | 12 | 274 | 548.4 KB | 15 | 0 | 0 | 00:09:13 |
| 2 | 023-084-030-207.res.spectrum.com | 411 | 7 | 13.8 KB | 2 | 0 | 0 | 03:47:49 |
| 3 | 69.167.39.53 | 14 | 0 | 0.0 KB | 0 | 13112 | 0 | 04:23:29 |
| TOTAL: 3 | 437 | 281 | 562.3 KB | 17 | 13112 | 0 | 30:52:54 | |
NNRP readership statistics (by domain):
| System | Conn | Arts | Size | Groups | Post | Rej | Elapsed | |
|---|---|---|---|---|---|---|---|---|
| 1 | unresolved | 27 | 274 | 548.4 KB | 15 | 13112 | 0 | 04:32:43 |
| 2 | *.res.spectrum.com | 411 | 7 | 13.8 KB | 2 | 0 | 0 | 03:47:49 |
| 3 | *.stehlik.co.uk | 893 | 0 | 0.0 KB | 0 | 0 | 0 | 22:32:21 |
| TOTAL: 3 | 1331 | 281 | 562.3 KB | 17 | 13112 | 0 | 30:52:54 | |
NNRP auth users [Top 20]:
| User | Conn |
|---|---|
| jesse | 425 |
| TOTAL: 1 | 425 |
NNRP total resource statistics [Top 20]:
| System | User(ms) | System(ms) | Idle(ms) | Elapsed |
|---|---|---|---|---|
| toma-03.stehlik.co.uk | 178.665 | 61.939 | 0.000 | 22:32:21 |
| 69.167.39.53 | 306.215 | 270.503 | 0.079 | 04:23:29 |
| 023-084-030-207.res.spectrum.com | 30.895 | 5.710 | 2.352 | 03:47:49 |
| 173.30.87.242 | 1.322 | 0.230 | 0.000 | 00:09:13 |
| 104.156.155.21 | 0.081 | 0.000 | 0.000 | 00:00:00 |
| TOTAL: 5 | 517.178 | 338.382 | 2.431 | 30:52:54 |
Curious NNRP server explorers [Top 20]:
| System | Conn |
|---|---|
| toma-03.stehlik.co.uk | 893 |
| 104.156.155.21 | 1 |
| TOTAL: 2 | 894 |
NNRP client timeouts [Top 20]:
| System | Conn | Peer |
|---|---|---|
| 023-084-030-207.res.spectrum.com | 411 | 411 |
| TOTAL: 1 | 411 | 412 |
Newsgroup request counts (by hierarchy):
| Hierarchy | Count | Pct | |
|---|---|---|---|
| 1 | rec | 274 | 97.9% |
| 2 | alt | 6 | 2.1% |
| TOTAL: 2 | 280 | 100.0% | |
Newsgroup request counts (by newsgroup) [Top 100]:
| Newsgroup | Count | |
|---|---|---|
| 1 | rec.food.cooking | 274 |
| 2 | alt.binaries.e-books | 6 |
| TOTAL: 2 | 280 | |