Log entries by program:
| Program name | Lines | %Lines | Size | %Size |
|---|---|---|---|---|
| nnrpd | 83237 | 55.2% | 7.9 MB | 50.6% |
| inn | 66227 | 43.9% | 7.5 MB | 48.1% |
| innd | 1259 | 0.8% | 180.2 KB | 1.1% |
| innfeed | 157 | 0.1% | 14.6 KB | 0.1% |
| nocem | 6 | 0.0% | 0.5 KB | 0.0% |
| controlchan | 1 | 0.0% | 0.0 KB | 0.0% |
| TOTAL: 6 | 150887 | 100.0% | 15.5 MB | 100.0% |
History cache:
| Reason | Count | %Count |
|---|---|---|
| Do not exist | 65856 | 96.0% |
| Negative hits | 2722 | 4.0% |
| Positive hits | 12 | 0.0% |
| Cache misses | 0 | 0.0% |
| TOTAL: 4 | 68590 | 100.0% |
INND timer:
| Code region | Time | Pct | Invoked | Min(ms) | Avg(ms) | Max(ms) |
|---|---|---|---|---|---|---|
| article cancel | 00:00:00.281 | 0.0% | 54 | 0.000 | 5.204 | 20.000 |
| article cleanup | 00:00:00.636 | 0.0% | 65872 | 0.000 | 0.010 | 0.058 |
| article logging | 00:00:01.030 | 0.0% | 66225 | 0.000 | 0.016 | 0.062 |
| article parse | 00:01:01.306 | 0.1% | 6075130 | 0.000 | 0.010 | 0.034 |
| article write | 00:23:22.044 | 1.6% | 65041 | 3.913 | 21.556 | 33.873 |
| artlog/artcncl | 00:00:00.001 | 0.0% | 10 | 0.000 | 0.100 | 1.000 |
| artlog/artparse | 00:00:00.000 | 0.0% | 0 | 0.000 | 0.000 | 0.000 |
| data move | 00:00:05.076 | 0.0% | 6570275 | 0.000 | 0.001 | 0.011 |
| hisgrep/artcncl | 00:00:00.054 | 0.0% | 64 | 0.000 | 0.844 | 9.000 |
| hishave/artcncl | 00:00:00.000 | 0.0% | 12 | 0.000 | 0.000 | 0.000 |
| history grep | 00:00:00.000 | 0.0% | 0 | 0.000 | 0.000 | 0.000 |
| history lookup | 00:00:14.843 | 0.0% | 68594 | 0.100 | 0.216 | 0.411 |
| history sync | 00:00:01.526 | 0.0% | 320 | 0.000 | 4.769 | 8.333 |
| history write | 00:00:56.423 | 0.1% | 65872 | 0.471 | 0.857 | 1.173 |
| hiswrite/artcncl | 00:00:00.000 | 0.0% | 0 | 0.000 | 0.000 | 0.000 |
| idle | 23:10:03.559 | 96.5% | 6067515 | 0.675 | 13.746 | 8694.536 |
| nntp read | 00:02:10.948 | 0.2% | 6067699 | 0.000 | 0.022 | 0.112 |
| overview write | 00:00:19.502 | 0.0% | 65041 | 0.100 | 0.300 | 5.690 |
| perl filter | 00:00:09.238 | 0.0% | 65845 | 0.000 | 0.140 | 0.231 |
| python filter | 00:21:40.068 | 1.5% | 65872 | 0.551 | 19.736 | 31.514 |
| site send | 00:00:01.754 | 0.0% | 65076 | 0.000 | 0.027 | 0.081 |
| TOTAL: 24:00:37.462 | 24:00:08.289 | 100.0% | - | - | - | - |
INNfeed timer:
| Code region | Time | Pct | Invoked | Min(ms) | Avg(ms) | Max(ms) |
|---|---|---|---|---|---|---|
| article new | 00:00:00.000 | 0.0% | 0 | 0.000 | 0.000 | 0.000 |
| article prepare | 00:00:00.000 | 0.0% | 0 | 0.000 | 0.000 | 0.000 |
| article read | 00:00:00.000 | 0.0% | 0 | 0.000 | 0.000 | 0.000 |
| backlog stats | 00:00:00.006 | 0.0% | 3730 | 0.000 | 0.002 | 0.077 |
| callbacks | 00:00:00.000 | 0.0% | 0 | 0.000 | 0.000 | 0.000 |
| data read | 00:00:00.002 | 0.0% | 3 | 0.000 | 0.667 | 2.000 |
| data write | 00:00:00.000 | 0.0% | 3 | 0.000 | 0.000 | 0.000 |
| idle | 23:55:23.078 | 100.0% | 3730 | 17718.088 | 23089.297 | 24106.240 |
| status file | 00:00:00.003 | 0.0% | 6 | 0.250 | 0.500 | 1.000 |
| TOTAL: 23:55:23.123 | 23:55:23.089 | 100.0% | - | - | - | - |
nnrpd timer:
| Code region | Time | Pct | Invoked | Min(ms) | Avg(ms) | Max(ms) |
|---|---|---|---|---|---|---|
| hisgrep | 00:00:05.499 | 0.0% | 13922 | 0.000 | 0.395 | 9.000 |
| idle | 00:00:00.000 | 0.0% | 0 | 0.000 | 0.000 | 0.000 |
| newnews | 00:00:00.000 | 0.0% | 0 | 0.000 | 0.000 | 0.000 |
| nntpwrite | 00:22:38.280 | 1.1% | 13343959 | 0.000 | 0.102 | 153.800 |
| readart | 00:00:49.500 | 0.0% | 13922 | 0.000 | 3.556 | 16.500 |
| TOTAL: 34:45:48.191 | 00:23:33.279 | 1.1% | - | - | - | - |
Control commands to INND:
| Command | Number |
|---|---|
| flush | 5 |
| flushlogs | 2 |
| go | 1 |
| logmode | 2 |
| mode | 149 |
| name | 2 |
| pause | 1 |
| paused | 1 |
| reload | 2 |
| renumber | 1 |
| TOTAL: 10 | 166 |
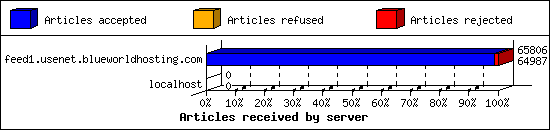
Incoming Feeds (INN):
| Server | Connects | Offered | Taken | Refused | Reject | %Accpt | Elapsed | |
|---|---|---|---|---|---|---|---|---|
| 1 | feed1.usenet.blueworldhosting.com | 11 | 65806 | 64987 | 0 | 819 | 98% | 24:49:51 |
| 2 | localhost | 2 | 0 | 0 | 0 | 0 | 0% | 00:00:00 |
| TOTAL: 2 | 13 | 65806 | 64987 | 0 | 819 | 98% | 24:49:51 | |
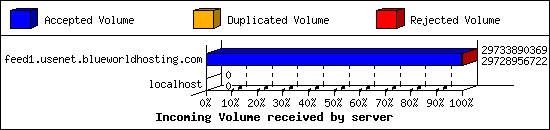
Incoming Volume (INN):
| Server | AcceptVol | DupVol | RejVol | TotalVol | %Acc | Vol/Art | |
|---|---|---|---|---|---|---|---|
| 1 | feed1.usenet.blueworldhosting.com | 27.7 GB | 0.0 KB | 4.7 MB | 27.7 GB | 99% | 441.3 KB |
| 2 | localhost | 0.0 KB | 0.0 KB | 0.0 KB | 0.0 KB | 0% | 0 |
| TOTAL: 2 | 27.7 GB | 0.0 KB | 4.7 MB | 27.7 GB | 99% | 441.3 KB | |
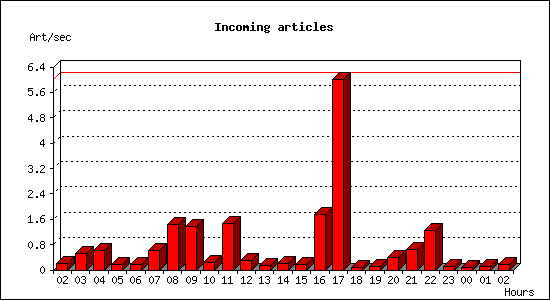
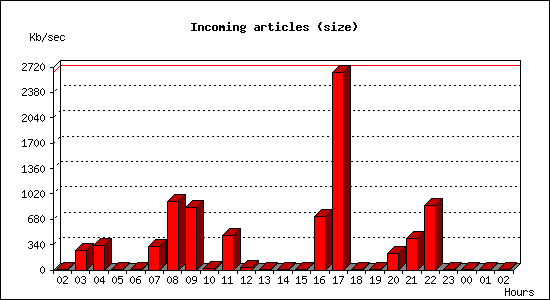
Incoming articles:
| Date | Articles | %Arts | Art/sec | Size | %Size | KB/sec |
|---|---|---|---|---|---|---|
| Sep 18 02:30:00 - 02:59:59 | 348 | 0.5% | 0.19 | 22.0 MB | 0.1% | 12.50 |
| Sep 18 03:00:00 - 03:59:59 | 1867 | 2.9% | 0.52 | 920.8 MB | 3.2% | 261.90 |
| Sep 18 04:00:00 - 04:59:59 | 2201 | 3.4% | 0.61 | 1.1 GB | 4.0% | 322.39 |
| Sep 18 05:00:00 - 05:59:59 | 591 | 0.9% | 0.16 | 35.2 MB | 0.1% | 10.00 |
| Sep 18 06:00:00 - 06:59:59 | 663 | 1.0% | 0.18 | 4.5 MB | 0.0% | 1.29 |
| Sep 18 07:00:00 - 07:59:59 | 2157 | 3.3% | 0.60 | 1.1 GB | 3.9% | 313.62 |
| Sep 18 08:00:00 - 08:59:59 | 5185 | 8.0% | 1.44 | 3.2 GB | 11.4% | 921.26 |
| Sep 18 09:00:00 - 09:59:59 | 4899 | 7.5% | 1.36 | 2.9 GB | 10.4% | 835.89 |
| Sep 18 10:00:00 - 10:59:59 | 868 | 1.3% | 0.24 | 56.1 MB | 0.2% | 15.96 |
| Sep 18 11:00:00 - 11:59:59 | 5235 | 8.0% | 1.45 | 1.6 GB | 5.8% | 468.41 |
| Sep 18 12:00:00 - 12:59:59 | 1024 | 1.6% | 0.28 | 98.8 MB | 0.3% | 28.09 |
| Sep 18 13:00:00 - 13:59:59 | 545 | 0.8% | 0.15 | 1.6 MB | 0.0% | 0.47 |
| Sep 18 14:00:00 - 14:59:59 | 722 | 1.1% | 0.20 | 3.8 MB | 0.0% | 1.08 |
| Sep 18 15:00:00 - 15:59:59 | 603 | 0.9% | 0.17 | 2.1 MB | 0.0% | 0.61 |
| Sep 18 16:00:00 - 16:59:59 | 6253 | 9.6% | 1.74 | 2.5 GB | 8.9% | 719.74 |
| Sep 18 17:00:00 - 17:59:59 | 21612 | 33.2% | 6.00 | 9.1 GB | 32.8% | 2643.98 |
| Sep 18 18:00:00 - 18:59:59 | 297 | 0.5% | 0.08 | 992.0 KB | 0.0% | 0.28 |
| Sep 18 19:00:00 - 19:59:59 | 354 | 0.5% | 0.10 | 3.2 MB | 0.0% | 0.90 |
| Sep 18 20:00:00 - 20:59:59 | 1402 | 2.2% | 0.39 | 800.1 MB | 2.8% | 227.57 |
| Sep 18 21:00:00 - 21:59:59 | 2290 | 3.5% | 0.64 | 1.4 GB | 5.2% | 418.78 |
| Sep 18 22:00:00 - 22:59:59 | 4473 | 6.9% | 1.24 | 2.9 GB | 10.7% | 858.97 |
| Sep 18 23:00:00 - 23:59:59 | 358 | 0.6% | 0.10 | 13.1 MB | 0.0% | 3.72 |
| Sep 19 00:00:00 - 00:59:59 | 312 | 0.5% | 0.09 | 1.2 MB | 0.0% | 0.34 |
| Sep 19 01:00:00 - 01:59:59 | 446 | 0.7% | 0.12 | 2.7 MB | 0.0% | 0.77 |
| Sep 19 02:00:00 - 02:30:00 | 330 | 0.5% | 0.18 | 931.0 KB | 0.0% | 0.52 |
| TOTAL: 24:00:00 | 65035 | 100.0% | 0.75 | 27.7 GB | 100.0% | 335.94 |
Sites sending bad articles:
| Server | Total | Group | Dist | Duplic | Unapp | TooOld | Site | Line | Other | |
|---|---|---|---|---|---|---|---|---|---|---|
| 1 | feed1.usenet.blueworldhosting.com | 1182 | 804 | 0 | 0 | 0 | 0 | 0 | 0 | 378 |
| TOTAL: 1 | 1182 | 804 | 0 | 0 | 0 | 0 | 0 | 0 | 378 | |
Unwanted newsgroups [Top 20]:
| Newsgroup | Count |
|---|---|
| talk.ukrainian.tg | 258 |
| al.binaries.test | 203 |
| talk.english.tg | 59 |
| alt.binaries.pictures.wallpaper | 48 |
| talk.generic.ua.ws | 15 |
| wolfsburg.test | 15 |
| panix.chat | 13 |
| alt.binaries.pictures.nude.celebrities.fake | 10 |
| finet.binaries.keskustelu | 9 |
| alt.binaries.pictures.scenic | 9 |
| alt.binaries.nospam.female.bodyhair | 9 |
| alt.binaries.comp | 9 |
| alt.binaries.howard-stern | 7 |
| alt.binaries.nospam.female.bodyhair.pubes | 7 |
| de.org.politik.misc | 6 |
| alt.binaries.3d.poser | 6 |
| alt.binaries.test.yenc | 6 |
| alt.binaries.sounds.lossless | 6 |
| alt.binaries.sacd.iso | 5 |
| alt.binaries.pictures.teen-starlets | 5 |
| TOTAL: 73 | 804 |
INND Python filter [Top 20]:
| Reason | Count |
|---|---|
| Bad Subject (Solution manual ) | 11 |
| Bad Subject (Solution Manual ) | 10 |
| Bad From (FBInCIAnNSATerroristSlayer@yahoo.com) | 5 |
| Bad Subject (Buy ketamine) | 1 |
| TOTAL: 4 | 27 |
NoCeM on Spool:
| Id | Good | Bad | Unique | Total |
|---|---|---|---|---|
| bleachbot@httrack.com | 2 | 0 | 2 | 2 |
| TOTAL: 1 | 2 | 0 | 2 | 2 |
Miscellaneous innd statistics [Top 10]:
| Event | Server | Number |
|---|---|---|
| Including strange strings | ||
| feed1.usenet.blueworldhosting.com | 351 | |
| TOTAL: 1 | 351 | |
| TOTAL: 1 | 351 | |
Outgoing Feeds (innfeed) by Articles:
| Server | Offered | Taken | Refused | Reject | Miss | Spool | %Took | Elapsed | |
|---|---|---|---|---|---|---|---|---|---|
| 1 | feed1.usenet.blueworldhosting.com | 0 | 0 | 0 | 0 | 0 | 0 | 0% | 00:10:00 |
| TOTAL: 1 | 0 | 0 | 0 | 0 | 0 | 0 | 0% | 00:10:00 | |
Outgoing Feeds (innfeed) by Volume:
| Server | AcceptVol | RejectVol | TotalVol | Volume/sec | Vol/Art | Elapsed | |
|---|---|---|---|---|---|---|---|
| 1 | feed1.usenet.blueworldhosting.com | 0.0 KB | 0.0 KB | 0.0 KB | 0.0 KB/s | 0 | 00:10:00 |
| TOTAL: 1 | 0.0 KB | 0.0 KB | 0.0 KB | 0.0 KB/s | 0 | 00:10:00 | |
NNRP readership statistics:
| System | Conn | Arts | Size | Groups | Post | Rej | Elapsed | |
|---|---|---|---|---|---|---|---|---|
| 1 | 023-084-030-207.res.spectrum.com | 452 | 3 | 8.4 KB | 1 | 10538 | 6 | 08:09:50 |
| 2 | 208.91.71.160 | 56 | 0 | 0.0 KB | 0 | 7346 | 0 | 04:10:52 |
| TOTAL: 2 | 508 | 3 | 8.4 KB | 1 | 17884 | 6 | 34:45:40 | |
NNRP readership statistics (by domain):
| System | Conn | Arts | Size | Groups | Post | Rej | Elapsed | |
|---|---|---|---|---|---|---|---|---|
| 1 | *.res.spectrum.com | 452 | 3 | 8.4 KB | 1 | 10538 | 6 | 08:09:50 |
| 2 | *.monitoring.internet-measurement.com | 11 | 0 | 0.0 KB | 0 | 0 | 0 | 00:00:07 |
| 3 | unresolved | 69 | 0 | 0.0 KB | 0 | 7346 | 0 | 04:10:55 |
| 4 | *.stehlik.co.uk | 901 | 0 | 0.0 KB | 0 | 0 | 0 | 22:24:47 |
| TOTAL: 4 | 1433 | 3 | 8.4 KB | 1 | 17884 | 6 | 34:45:40 | |
NNRP auth users [Top 20]:
| User | Conn |
|---|---|
| jesse | 508 |
| TOTAL: 1 | 508 |
NNRP total resource statistics [Top 20]:
| System | User(ms) | System(ms) | Idle(ms) | Elapsed |
|---|---|---|---|---|
| toma-03.stehlik.co.uk | 179.938 | 60.633 | 0.000 | 22:24:47 |
| 023-084-030-207.res.spectrum.com | 279.473 | 213.755 | 2.309 | 08:09:50 |
| 208.91.71.160 | 176.882 | 152.631 | 0.285 | 04:10:52 |
| successful.monitoring.internet-measurement.com | 0.068 | 0.015 | 0.000 | 00:00:06 |
| 208.100.26.233 | 0.781 | 0.135 | 0.000 | 00:00:03 |
| joyful.monitoring.internet-measurement.com | 0.076 | 0.000 | 0.000 | 00:00:00 |
| unwavering.monitoring.internet-measurement.com | 0.067 | 0.015 | 0.000 | 00:00:00 |
| 92.255.85.183 | 0.069 | 0.009 | 0.000 | 00:00:00 |
| valued.monitoring.internet-measurement.com | 0.077 | 0.000 | 0.000 | 00:00:00 |
| TOTAL: 9 | 637.431 | 427.193 | 2.594 | 34:45:40 |
Curious NNRP server explorers [Top 20]:
| System | Conn |
|---|---|
| toma-03.stehlik.co.uk | 901 |
| 208.100.26.233 | 12 |
| joyful.monitoring.internet-measurement.com | 1 |
| bright.monitoring.internet-measurement.com | 1 |
| 92.255.85.183 | 1 |
| majestic.monitoring.internet-measurement.com | 1 |
| prominent.monitoring.internet-measurement.com | 1 |
| unwavering.monitoring.internet-measurement.com | 1 |
| equitable.monitoring.internet-measurement.com | 1 |
| versatile.monitoring.internet-measurement.com | 1 |
| valued.monitoring.internet-measurement.com | 1 |
| supportive.monitoring.internet-measurement.com | 1 |
| impressive.monitoring.internet-measurement.com | 1 |
| successful.monitoring.internet-measurement.com | 1 |
| TOTAL: 14 | 925 |
NNRP gethostbyaddr failures [Top 20]:
| System | Conn |
|---|---|
| ? (can't getpeername) | 20 |
| TOTAL: 1 | 20 |
NNRP client timeouts [Top 20]:
| System | Conn | Peer |
|---|---|---|
| 023-084-030-207.res.spectrum.com | 370 | 370 |
| TOTAL: 1 | 370 | 371 |
Newsgroup request counts (by hierarchy):
| Hierarchy | Count | Pct | |
|---|---|---|---|
| 1 | alt | 1 | 100.0% |
| TOTAL: 1 | 1 | 100.0% | |
Newsgroup request counts (by newsgroup) [Top 100]:
| Newsgroup | Count | |
|---|---|---|
| 1 | alt.binaries.e-books | 1 |
| TOTAL: 1 | 1 | |