Log entries by program:
| Program name | Lines | %Lines | Size | %Size |
|---|---|---|---|---|
| nnrpd | 49646 | 51.4% | 4.4 MB | 45.2% |
| inn | 45629 | 47.2% | 5.1 MB | 52.7% |
| innd | 1222 | 1.3% | 183.4 KB | 1.9% |
| innfeed | 158 | 0.2% | 15.2 KB | 0.2% |
| nocem | 7 | 0.0% | 0.6 KB | 0.0% |
| controlchan | 1 | 0.0% | 0.1 KB | 0.0% |
| TOTAL: 6 | 96663 | 100.0% | 9.6 MB | 100.0% |
History cache:
| Reason | Count | %Count |
|---|---|---|
| Do not exist | 45272 | 94.5% |
| Negative hits | 2608 | 5.4% |
| Positive hits | 14 | 0.0% |
| Cache misses | 0 | 0.0% |
| TOTAL: 4 | 47894 | 100.0% |
INND timer:
| Code region | Time | Pct | Invoked | Min(ms) | Avg(ms) | Max(ms) |
|---|---|---|---|---|---|---|
| article cancel | 00:00:00.280 | 0.0% | 86 | 0.000 | 3.256 | 20.000 |
| article cleanup | 00:00:00.458 | 0.0% | 45282 | 0.000 | 0.010 | 0.043 |
| article logging | 00:00:00.766 | 0.0% | 45626 | 0.000 | 0.017 | 0.083 |
| article parse | 00:00:30.169 | 0.0% | 2918260 | 0.000 | 0.010 | 0.038 |
| article write | 00:16:13.301 | 1.1% | 44432 | 4.224 | 21.905 | 34.051 |
| artlog/artcncl | 00:00:00.001 | 0.0% | 11 | 0.000 | 0.091 | 1.000 |
| artlog/artparse | 00:00:00.000 | 0.0% | 0 | 0.000 | 0.000 | 0.000 |
| data move | 00:00:02.771 | 0.0% | 3187800 | 0.000 | 0.001 | 0.019 |
| hisgrep/artcncl | 00:00:00.043 | 0.0% | 97 | 0.000 | 0.443 | 7.000 |
| hishave/artcncl | 00:00:00.000 | 0.0% | 14 | 0.000 | 0.000 | 0.000 |
| history grep | 00:00:00.000 | 0.0% | 0 | 0.000 | 0.000 | 0.000 |
| history lookup | 00:00:10.192 | 0.0% | 47890 | 0.091 | 0.213 | 0.410 |
| history sync | 00:00:01.624 | 0.0% | 322 | 0.000 | 5.043 | 9.000 |
| history write | 00:00:39.864 | 0.0% | 45282 | 0.500 | 0.880 | 1.170 |
| hiswrite/artcncl | 00:00:00.000 | 0.0% | 0 | 0.000 | 0.000 | 0.000 |
| idle | 23:30:28.392 | 97.9% | 2914307 | 0.865 | 29.039 | 11997.620 |
| nntp read | 00:01:05.568 | 0.1% | 2914095 | 0.000 | 0.023 | 0.074 |
| overview write | 00:00:16.561 | 0.0% | 44432 | 0.120 | 0.373 | 6.000 |
| perl filter | 00:00:04.927 | 0.0% | 45254 | 0.000 | 0.109 | 0.196 |
| python filter | 00:10:44.579 | 0.7% | 45282 | 0.626 | 14.235 | 29.612 |
| site send | 00:00:01.292 | 0.0% | 44475 | 0.000 | 0.029 | 0.105 |
| TOTAL: 24:00:42.376 | 24:00:20.788 | 100.0% | - | - | - | - |
INNfeed timer:
| Code region | Time | Pct | Invoked | Min(ms) | Avg(ms) | Max(ms) |
|---|---|---|---|---|---|---|
| article new | 00:00:00.000 | 0.0% | 0 | 0.000 | 0.000 | 0.000 |
| article prepare | 00:00:00.000 | 0.0% | 0 | 0.000 | 0.000 | 0.000 |
| article read | 00:00:00.000 | 0.0% | 0 | 0.000 | 0.000 | 0.000 |
| backlog stats | 00:00:00.002 | 0.0% | 3726 | 0.000 | 0.001 | 0.038 |
| callbacks | 00:00:00.000 | 0.0% | 0 | 0.000 | 0.000 | 0.000 |
| data read | 00:00:00.000 | 0.0% | 3 | 0.000 | 0.000 | 0.000 |
| data write | 00:00:00.000 | 0.0% | 3 | 0.000 | 0.000 | 0.000 |
| idle | 23:56:38.136 | 100.0% | 3726 | 17406.571 | 23134.229 | 25088.833 |
| status file | 00:00:00.001 | 0.0% | 6 | 0.000 | 0.167 | 0.500 |
| TOTAL: 23:56:38.205 | 23:56:38.139 | 100.0% | - | - | - | - |
nnrpd timer:
| Code region | Time | Pct | Invoked | Min(ms) | Avg(ms) | Max(ms) |
|---|---|---|---|---|---|---|
| hisgrep | 00:00:02.692 | 0.0% | 3943 | 0.333 | 0.683 | 7.000 |
| idle | 00:00:00.000 | 0.0% | 0 | 0.000 | 0.000 | 0.000 |
| newnews | 00:00:00.000 | 0.0% | 0 | 0.000 | 0.000 | 0.000 |
| nntpwrite | 00:15:18.363 | 0.8% | 9863383 | 0.000 | 0.093 | 111.714 |
| readart | 00:00:01.550 | 0.0% | 105 | 0.000 | 14.762 | 37.500 |
| TOTAL: 31:08:35.183 | 00:15:22.605 | 0.8% | - | - | - | - |
Control commands to INND:
| Command | Number |
|---|---|
| flush | 5 |
| flushlogs | 2 |
| go | 1 |
| logmode | 2 |
| mode | 149 |
| name | 2 |
| pause | 1 |
| paused | 1 |
| reload | 2 |
| renumber | 1 |
| TOTAL: 10 | 166 |
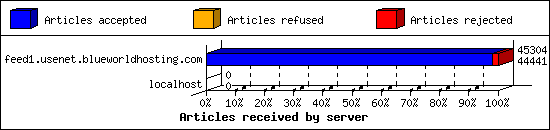
Incoming Feeds (INN):
| Server | Connects | Offered | Taken | Refused | Reject | %Accpt | Elapsed | |
|---|---|---|---|---|---|---|---|---|
| 1 | feed1.usenet.blueworldhosting.com | 25 | 45304 | 44441 | 0 | 863 | 98% | 26:11:45 |
| 2 | localhost | 2 | 0 | 0 | 0 | 0 | 0% | 00:00:00 |
| TOTAL: 2 | 27 | 45304 | 44441 | 0 | 863 | 98% | 26:11:45 | |
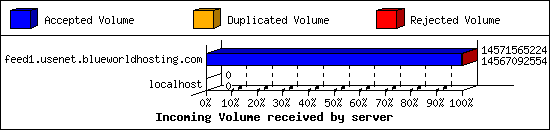
Incoming Volume (INN):
| Server | AcceptVol | DupVol | RejVol | TotalVol | %Acc | Vol/Art | |
|---|---|---|---|---|---|---|---|
| 1 | feed1.usenet.blueworldhosting.com | 13.6 GB | 0.0 KB | 4.3 MB | 13.6 GB | 99% | 314.1 KB |
| 2 | localhost | 0.0 KB | 0.0 KB | 0.0 KB | 0.0 KB | 0% | 0 |
| TOTAL: 2 | 13.6 GB | 0.0 KB | 4.3 MB | 13.6 GB | 99% | 314.1 KB | |
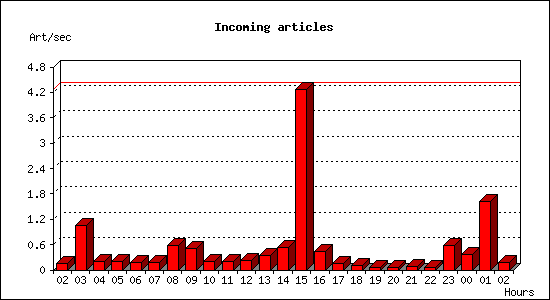
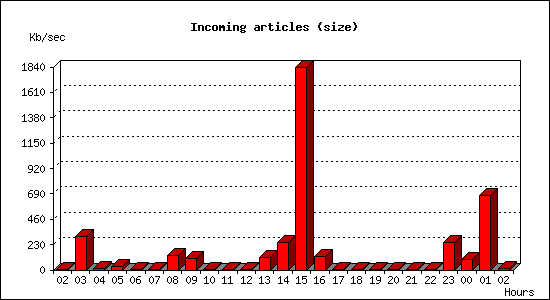
Incoming articles:
| Date | Articles | %Arts | Art/sec | Size | %Size | KB/sec |
|---|---|---|---|---|---|---|
| Sep 19 02:30:00 - 02:59:59 | 289 | 0.7% | 0.16 | 870.2 KB | 0.0% | 0.48 |
| Sep 19 03:00:00 - 03:59:59 | 3789 | 8.5% | 1.05 | 1.1 GB | 7.7% | 306.13 |
| Sep 19 04:00:00 - 04:59:59 | 730 | 1.6% | 0.20 | 54.4 MB | 0.4% | 15.47 |
| Sep 19 05:00:00 - 05:59:59 | 757 | 1.7% | 0.21 | 98.4 MB | 0.7% | 27.98 |
| Sep 19 06:00:00 - 06:59:59 | 616 | 1.4% | 0.17 | 28.7 MB | 0.2% | 8.16 |
| Sep 19 07:00:00 - 07:59:59 | 620 | 1.4% | 0.17 | 2.0 MB | 0.0% | 0.58 |
| Sep 19 08:00:00 - 08:59:59 | 2109 | 4.7% | 0.59 | 457.9 MB | 3.3% | 130.25 |
| Sep 19 09:00:00 - 09:59:59 | 1831 | 4.1% | 0.51 | 375.5 MB | 2.7% | 106.82 |
| Sep 19 10:00:00 - 10:59:59 | 700 | 1.6% | 0.19 | 3.9 MB | 0.0% | 1.10 |
| Sep 19 11:00:00 - 11:59:59 | 750 | 1.7% | 0.21 | 3.5 MB | 0.0% | 1.01 |
| Sep 19 12:00:00 - 12:59:59 | 800 | 1.8% | 0.22 | 2.4 MB | 0.0% | 0.68 |
| Sep 19 13:00:00 - 13:59:59 | 1266 | 2.8% | 0.35 | 383.5 MB | 2.8% | 109.09 |
| Sep 19 14:00:00 - 14:59:59 | 1876 | 4.2% | 0.52 | 881.2 MB | 6.3% | 250.65 |
| Sep 19 15:00:00 - 15:59:59 | 15386 | 34.6% | 4.27 | 6.3 GB | 46.4% | 1835.49 |
| Sep 19 16:00:00 - 16:59:59 | 1571 | 3.5% | 0.44 | 442.5 MB | 3.2% | 125.85 |
| Sep 19 17:00:00 - 17:59:59 | 556 | 1.3% | 0.15 | 11.4 MB | 0.1% | 3.25 |
| Sep 19 18:00:00 - 18:59:59 | 342 | 0.8% | 0.10 | 1.5 MB | 0.0% | 0.43 |
| Sep 19 19:00:00 - 19:59:59 | 252 | 0.6% | 0.07 | 1.1 MB | 0.0% | 0.30 |
| Sep 19 20:00:00 - 20:59:59 | 234 | 0.5% | 0.07 | 754.5 KB | 0.0% | 0.21 |
| Sep 19 21:00:00 - 21:59:59 | 264 | 0.6% | 0.07 | 2.2 MB | 0.0% | 0.63 |
| Sep 19 22:00:00 - 22:59:59 | 181 | 0.4% | 0.05 | 726.8 KB | 0.0% | 0.20 |
| Sep 19 23:00:00 - 23:59:59 | 2083 | 4.7% | 0.58 | 869.9 MB | 6.3% | 247.44 |
| Sep 20 00:00:00 - 00:59:59 | 1290 | 2.9% | 0.36 | 324.9 MB | 2.3% | 92.43 |
| Sep 20 01:00:00 - 01:59:59 | 5826 | 13.1% | 1.62 | 2.3 GB | 17.2% | 678.86 |
| Sep 20 02:00:00 - 02:30:00 | 306 | 0.7% | 0.17 | 29.2 MB | 0.2% | 16.61 |
| TOTAL: 24:00:00 | 44424 | 100.0% | 0.51 | 13.6 GB | 100.0% | 164.65 |
Sites sending bad articles:
| Server | Total | Group | Dist | Duplic | Unapp | TooOld | Site | Line | Other | |
|---|---|---|---|---|---|---|---|---|---|---|
| 1 | feed1.usenet.blueworldhosting.com | 1194 | 821 | 0 | 0 | 1 | 0 | 0 | 0 | 372 |
| TOTAL: 1 | 1194 | 821 | 0 | 0 | 1 | 0 | 0 | 0 | 372 | |
Unwanted newsgroups [Top 20]:
| Newsgroup | Count |
|---|---|
| talk.ukrainian.tg | 302 |
| al.binaries.test | 244 |
| talk.english.tg | 53 |
| finet.binaries.keskustelu | 26 |
| alt.binaries.sacd.iso | 15 |
| talk.generic.ua.ws | 15 |
| wolfsburg.test | 14 |
| news.oriens-occasus.ru | 11 |
| alt.binaries.test.yenc | 10 |
| alt.binaries.3d.poser | 9 |
| alt.culture.underwear | 9 |
| alt.binaries.pictures.nude.celebrities.fake | 9 |
| alt.binaries.pictures.teen-starlets | 7 |
| alt.binaries.howard-stern | 7 |
| alt.binaries.multimedia.erotica.amateur | 5 |
| alt.binaries.drwho | 5 |
| alt.binaries.mp3.audiobooks | 4 |
| alt.binaries.pictures.earlmiller | 4 |
| talk.english.tw | 3 |
| alt.binaries.pictures.purebeauty | 3 |
| TOTAL: 71 | 821 |
Supposedly-moderated groups with unmoderated postings [Top 20]:
| Groups | Count |
|---|---|
| bit.listserv.catholic | 1 |
| TOTAL: 1 | 1 |
INND Python filter [Top 20]:
| Reason | Count |
|---|---|
| Bad Subject (Solution manual ) | 10 |
| Bad From (FBInCIAnNSATerroristSlayer@yahoo.com) | 10 |
| Bad Subject (Solution Manual ) | 7 |
| Bad Subject (Buy GBL) | 1 |
| TOTAL: 4 | 28 |
NoCeM on Spool:
| Id | Good | Bad | Unique | Total |
|---|---|---|---|---|
| bleachbot@httrack.com | 3 | 0 | 3 | 3 |
| TOTAL: 1 | 3 | 0 | 3 | 3 |
Miscellaneous innd statistics [Top 10]:
| Event | Server | Number |
|---|---|---|
| Including strange strings | ||
| feed1.usenet.blueworldhosting.com | 344 | |
| TOTAL: 1 | 344 | |
| TOTAL: 1 | 344 | |
Outgoing Feeds (innfeed) by Articles:
| Server | Offered | Taken | Refused | Reject | Miss | Spool | %Took | Elapsed | |
|---|---|---|---|---|---|---|---|---|---|
| 1 | feed1.usenet.blueworldhosting.com | 0 | 0 | 0 | 0 | 0 | 0 | 0% | 00:10:00 |
| TOTAL: 1 | 0 | 0 | 0 | 0 | 0 | 0 | 0% | 00:10:00 | |
Outgoing Feeds (innfeed) by Volume:
| Server | AcceptVol | RejectVol | TotalVol | Volume/sec | Vol/Art | Elapsed | |
|---|---|---|---|---|---|---|---|
| 1 | feed1.usenet.blueworldhosting.com | 0.0 KB | 0.0 KB | 0.0 KB | 0.0 KB/s | 0 | 00:10:00 |
| TOTAL: 1 | 0.0 KB | 0.0 KB | 0.0 KB | 0.0 KB/s | 0 | 00:10:00 | |
NNRP readership statistics:
| System | Conn | Arts | Size | Groups | Post | Rej | Elapsed | |
|---|---|---|---|---|---|---|---|---|
| 1 | 173.30.87.242 | 2 | 87 | 156.6 KB | 2 | 0 | 0 | 00:01:28 |
| 2 | 023-084-030-207.res.spectrum.com | 648 | 18 | 24.5 KB | 5 | 2 | 0 | 06:28:35 |
| TOTAL: 2 | 650 | 105 | 181.1 KB | 7 | 2 | 0 | 31:08:27 | |
NNRP readership statistics (by domain):
| System | Conn | Arts | Size | Groups | Post | Rej | Elapsed | |
|---|---|---|---|---|---|---|---|---|
| 1 | unresolved | 6 | 87 | 156.6 KB | 2 | 0 | 0 | 00:01:42 |
| 2 | *.res.spectrum.com | 648 | 18 | 24.5 KB | 5 | 2 | 0 | 06:28:35 |
| 3 | *.stehlik.co.uk | 689 | 0 | 0.0 KB | 0 | 0 | 0 | 24:38:10 |
| TOTAL: 3 | 1343 | 105 | 181.1 KB | 7 | 2 | 0 | 31:08:27 | |
NNRP auth users [Top 20]:
| User | Conn |
|---|---|
| jesse | 648 |
| TOTAL: 1 | 648 |
NNRP total resource statistics [Top 20]:
| System | User(ms) | System(ms) | Idle(ms) | Elapsed |
|---|---|---|---|---|
| toma-03.stehlik.co.uk | 134.375 | 45.859 | 0.000 | 24:38:10 |
| 023-084-030-207.res.spectrum.com | 49.506 | 11.099 | 3.406 | 06:28:35 |
| 173.30.87.242 | 0.199 | 0.099 | 0.000 | 00:01:28 |
| 50.31.21.8 | 0.229 | 0.008 | 0.000 | 00:00:12 |
| 104.156.155.25 | 0.073 | 0.007 | 0.000 | 00:00:00 |
| TOTAL: 5 | 184.382 | 57.072 | 3.406 | 31:08:27 |
Curious NNRP server explorers [Top 20]:
| System | Conn |
|---|---|
| toma-03.stehlik.co.uk | 689 |
| 50.31.21.8 | 3 |
| 104.156.155.25 | 1 |
| TOTAL: 3 | 693 |
NNRP gethostbyaddr failures [Top 20]:
| System | Conn |
|---|---|
| ? (can't getpeername) | 1 |
| TOTAL: 1 | 1 |
NNRP client timeouts [Top 20]:
| System | Conn | Peer |
|---|---|---|
| 023-084-030-207.res.spectrum.com | 648 | 648 |
| toma-03.stehlik.co.uk | 19 | 6 |
| TOTAL: 2 | 667 | 655 |
Newsgroup request counts (by hierarchy):
| Hierarchy | Count | Pct | |
|---|---|---|---|
| 1 | rec | 87 | 88.8% |
| 2 | alt | 11 | 11.2% |
| TOTAL: 2 | 98 | 100.0% | |
Newsgroup request counts (by newsgroup) [Top 100]:
| Newsgroup | Count | |
|---|---|---|
| 1 | rec.food.cooking | 87 |
| 2 | alt.binaries.e-books | 6 |
| 3 | alt.binaries.documentaries | 5 |
| TOTAL: 3 | 98 | |