Log entries by program:
| Program name | Lines | %Lines | Size | %Size |
|---|---|---|---|---|
| inn | 84432 | 55.1% | 9.3 MB | 60.2% |
| nnrpd | 67167 | 43.9% | 6.0 MB | 38.6% |
| innd | 1381 | 0.9% | 188.8 KB | 1.2% |
| innfeed | 159 | 0.1% | 14.7 KB | 0.1% |
| nocem | 1 | 0.0% | 0.1 KB | 0.0% |
| controlchan | 1 | 0.0% | 0.1 KB | 0.0% |
| TOTAL: 6 | 153141 | 100.0% | 15.5 MB | 100.0% |
History cache:
| Reason | Count | %Count |
|---|---|---|
| Do not exist | 83975 | 98.6% |
| Negative hits | 1188 | 1.4% |
| Positive hits | 16 | 0.0% |
| Cache misses | 11 | 0.0% |
| TOTAL: 4 | 85190 | 100.0% |
INND timer:
| Code region | Time | Pct | Invoked | Min(ms) | Avg(ms) | Max(ms) |
|---|---|---|---|---|---|---|
| article cancel | 00:00:00.294 | 0.0% | 66 | 0.000 | 4.455 | 24.000 |
| article cleanup | 00:00:00.812 | 0.0% | 84065 | 0.000 | 0.010 | 0.042 |
| article logging | 00:00:01.331 | 0.0% | 84421 | 0.000 | 0.016 | 0.058 |
| article parse | 00:01:01.996 | 0.1% | 6238684 | 0.000 | 0.010 | 0.039 |
| article write | 00:34:40.458 | 2.4% | 83569 | 3.000 | 24.895 | 34.836 |
| artlog/artcncl | 00:00:00.000 | 0.0% | 27 | 0.000 | 0.000 | 0.000 |
| artlog/artparse | 00:00:00.000 | 0.0% | 0 | 0.000 | 0.000 | 0.000 |
| data move | 00:00:05.563 | 0.0% | 6835316 | 0.000 | 0.001 | 0.014 |
| hisgrep/artcncl | 00:00:00.093 | 0.0% | 93 | 0.000 | 1.000 | 8.000 |
| hishave/artcncl | 00:00:00.000 | 0.0% | 27 | 0.000 | 0.000 | 0.000 |
| history grep | 00:00:00.000 | 0.0% | 0 | 0.000 | 0.000 | 0.000 |
| history lookup | 00:00:18.661 | 0.0% | 85253 | 0.095 | 0.219 | 0.472 |
| history sync | 00:00:01.837 | 0.0% | 322 | 0.000 | 5.705 | 9.000 |
| history write | 00:01:04.809 | 0.1% | 84065 | 0.496 | 0.771 | 1.271 |
| hiswrite/artcncl | 00:00:00.000 | 0.0% | 0 | 0.000 | 0.000 | 0.000 |
| idle | 22:57:42.558 | 95.6% | 6221676 | 0.595 | 13.286 | 10713.232 |
| nntp read | 00:02:16.297 | 0.2% | 6221467 | 0.000 | 0.022 | 0.069 |
| overview write | 00:00:23.598 | 0.0% | 83569 | 0.127 | 0.282 | 3.364 |
| perl filter | 00:00:09.339 | 0.0% | 84045 | 0.000 | 0.111 | 0.236 |
| python filter | 00:22:11.202 | 1.5% | 84065 | 0.679 | 15.835 | 30.773 |
| site send | 00:00:02.340 | 0.0% | 83632 | 0.000 | 0.028 | 0.103 |
| TOTAL: 24:00:39.957 | 24:00:01.188 | 100.0% | - | - | - | - |
INNfeed timer:
| Code region | Time | Pct | Invoked | Min(ms) | Avg(ms) | Max(ms) |
|---|---|---|---|---|---|---|
| article new | 00:00:00.000 | 0.0% | 0 | 0.000 | 0.000 | 0.000 |
| article prepare | 00:00:00.000 | 0.0% | 0 | 0.000 | 0.000 | 0.000 |
| article read | 00:00:00.000 | 0.0% | 0 | 0.000 | 0.000 | 0.000 |
| backlog stats | 00:00:00.003 | 0.0% | 3731 | 0.000 | 0.001 | 0.038 |
| callbacks | 00:00:00.000 | 0.0% | 0 | 0.000 | 0.000 | 0.000 |
| data read | 00:00:00.000 | 0.0% | 3 | 0.000 | 0.000 | 0.000 |
| data write | 00:00:00.000 | 0.0% | 3 | 0.000 | 0.000 | 0.000 |
| idle | 23:56:24.912 | 100.0% | 3731 | 17686.618 | 23099.682 | 24202.920 |
| status file | 00:00:00.003 | 0.0% | 6 | 0.500 | 0.500 | 0.500 |
| TOTAL: 23:56:24.944 | 23:56:24.918 | 100.0% | - | - | - | - |
nnrpd timer:
| Code region | Time | Pct | Invoked | Min(ms) | Avg(ms) | Max(ms) |
|---|---|---|---|---|---|---|
| hisgrep | 00:00:01.381 | 0.0% | 2971 | 0.000 | 0.465 | 16.500 |
| idle | 00:00:00.000 | 0.0% | 0 | 0.000 | 0.000 | 0.000 |
| newnews | 00:00:00.000 | 0.0% | 0 | 0.000 | 0.000 | 0.000 |
| nntpwrite | 00:32:05.587 | 1.9% | 13193297 | 0.000 | 0.146 | 160.025 |
| readart | 00:00:12.538 | 0.0% | 3279 | 0.000 | 3.824 | 57.000 |
| TOTAL: 28:08:34.965 | 00:32:19.506 | 1.9% | - | - | - | - |
Control commands to INND:
| Command | Number |
|---|---|
| flush | 5 |
| flushlogs | 2 |
| go | 1 |
| logmode | 2 |
| mode | 149 |
| name | 2 |
| pause | 1 |
| paused | 1 |
| reload | 2 |
| renumber | 1 |
| TOTAL: 10 | 166 |
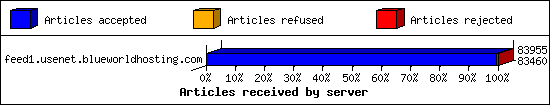
Incoming Feeds (INN):
| Server | Connects | Offered | Taken | Refused | Reject | %Accpt | Elapsed | |
|---|---|---|---|---|---|---|---|---|
| 1 | feed1.usenet.blueworldhosting.com | 29 | 83955 | 83460 | 0 | 495 | 99% | 26:53:02 |
| TOTAL: 1 | 29 | 83955 | 83460 | 0 | 495 | 99% | 26:53:02 | |
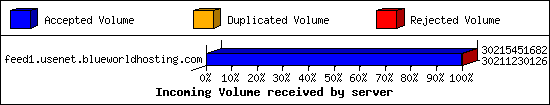
Incoming Volume (INN):
| Server | AcceptVol | DupVol | RejVol | TotalVol | %Acc | Vol/Art | |
|---|---|---|---|---|---|---|---|
| 1 | feed1.usenet.blueworldhosting.com | 28.1 GB | 0.0 KB | 4.0 MB | 28.1 GB | 99% | 351.5 KB |
| TOTAL: 1 | 28.1 GB | 0.0 KB | 4.0 MB | 28.1 GB | 99% | 351.5 KB | |
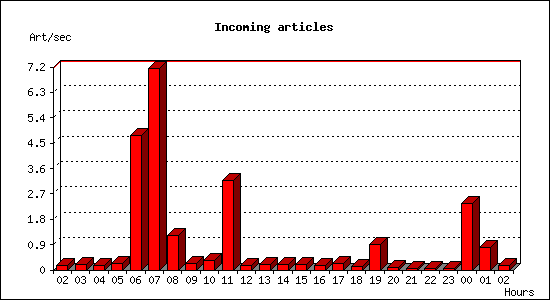
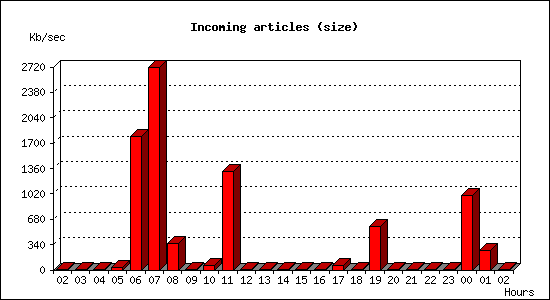
Incoming articles:
| Date | Articles | %Arts | Art/sec | Size | %Size | KB/sec |
|---|---|---|---|---|---|---|
| Sep 23 02:30:00 - 02:59:59 | 301 | 0.4% | 0.17 | 870.9 KB | 0.0% | 0.48 |
| Sep 23 03:00:00 - 03:59:59 | 709 | 0.8% | 0.20 | 1.9 MB | 0.0% | 0.53 |
| Sep 23 04:00:00 - 04:59:59 | 579 | 0.7% | 0.16 | 1.9 MB | 0.0% | 0.55 |
| Sep 23 05:00:00 - 05:59:59 | 859 | 1.0% | 0.24 | 106.8 MB | 0.4% | 30.38 |
| Sep 23 06:00:00 - 06:59:59 | 17123 | 20.5% | 4.76 | 6.1 GB | 21.8% | 1785.38 |
| Sep 23 07:00:00 - 07:59:59 | 25756 | 30.8% | 7.15 | 9.3 GB | 33.1% | 2709.62 |
| Sep 23 08:00:00 - 08:59:59 | 4415 | 5.3% | 1.23 | 1.2 GB | 4.4% | 359.66 |
| Sep 23 09:00:00 - 09:59:59 | 839 | 1.0% | 0.23 | 3.9 MB | 0.0% | 1.10 |
| Sep 23 10:00:00 - 10:59:59 | 1219 | 1.5% | 0.34 | 201.1 MB | 0.7% | 57.21 |
| Sep 23 11:00:00 - 11:59:59 | 11443 | 13.7% | 3.18 | 4.6 GB | 16.2% | 1325.34 |
| Sep 23 12:00:00 - 12:59:59 | 635 | 0.8% | 0.18 | 2.0 MB | 0.0% | 0.57 |
| Sep 23 13:00:00 - 13:59:59 | 735 | 0.9% | 0.20 | 2.4 MB | 0.0% | 0.69 |
| Sep 23 14:00:00 - 14:59:59 | 649 | 0.8% | 0.18 | 2.2 MB | 0.0% | 0.64 |
| Sep 23 15:00:00 - 15:59:59 | 668 | 0.8% | 0.19 | 3.5 MB | 0.0% | 0.98 |
| Sep 23 16:00:00 - 16:59:59 | 548 | 0.7% | 0.15 | 2.0 MB | 0.0% | 0.58 |
| Sep 23 17:00:00 - 17:59:59 | 785 | 0.9% | 0.22 | 213.2 MB | 0.7% | 60.64 |
| Sep 23 18:00:00 - 18:59:59 | 396 | 0.5% | 0.11 | 18.5 MB | 0.1% | 5.27 |
| Sep 23 19:00:00 - 19:59:59 | 3221 | 3.9% | 0.89 | 2.0 GB | 7.1% | 580.51 |
| Sep 23 20:00:00 - 20:59:59 | 335 | 0.4% | 0.09 | 39.6 MB | 0.1% | 11.25 |
| Sep 23 21:00:00 - 21:59:59 | 232 | 0.3% | 0.06 | 832.6 KB | 0.0% | 0.23 |
| Sep 23 22:00:00 - 22:59:59 | 207 | 0.2% | 0.06 | 819.7 KB | 0.0% | 0.23 |
| Sep 23 23:00:00 - 23:59:59 | 251 | 0.3% | 0.07 | 885.5 KB | 0.0% | 0.25 |
| Sep 24 00:00:00 - 00:59:59 | 8429 | 10.1% | 2.34 | 3.4 GB | 12.2% | 999.62 |
| Sep 24 01:00:00 - 01:59:59 | 2934 | 3.5% | 0.81 | 930.9 MB | 3.2% | 264.80 |
| Sep 24 02:00:00 - 02:30:00 | 290 | 0.3% | 0.16 | 892.3 KB | 0.0% | 0.50 |
| TOTAL: 24:00:00 | 83558 | 100.0% | 0.97 | 28.1 GB | 100.0% | 341.52 |
Sites sending bad articles:
| Server | Total | Group | Dist | Duplic | Unapp | TooOld | Site | Line | Other | |
|---|---|---|---|---|---|---|---|---|---|---|
| 1 | feed1.usenet.blueworldhosting.com | 847 | 474 | 0 | 0 | 1 | 0 | 0 | 0 | 372 |
| TOTAL: 1 | 847 | 474 | 0 | 0 | 1 | 0 | 0 | 0 | 372 | |
Unwanted newsgroups [Top 20]:
| Newsgroup | Count |
|---|---|
| al.binaries.test | 137 |
| talk.generic.ua.ws | 130 |
| finet.binaries.keskustelu | 66 |
| alt.binaries.sacd.iso | 14 |
| alt.binaries.pictures.scenic | 11 |
| alt.binaries.nospam.female.bodyhair.pubes | 8 |
| alt.binaries.sounds.lossless | 8 |
| alt.binaries.test.yenc | 7 |
| alt.binaries.sounds.anime | 7 |
| alt.binaries.sounds.karaoke | 6 |
| alt.binaries.pictures.nude.celebrities.fake | 6 |
| alt.binaries.xxx | 5 |
| alt.binaries.movies.erotica | 5 |
| talk.from.diary | 4 |
| alt.binaries.ebook.flood | 4 |
| wolfsburg.test | 3 |
| alt.binaries.sounds.whitburn.pop | 3 |
| alt.binaries.pictures.earlmiller | 3 |
| alt.binaries.boneless | 3 |
| alt.binaries.multimedia.videos.music | 2 |
| TOTAL: 53 | 474 |
Supposedly-moderated groups with unmoderated postings [Top 20]:
| Groups | Count |
|---|---|
| bit.listserv.catholic | 1 |
| TOTAL: 1 | 1 |
INND Python filter [Top 20]:
| Reason | Count |
|---|---|
| Bad Subject (Solution manual ) | 9 |
| Bad Subject (Solution Manual ) | 7 |
| Bad Subject (Buy ketamine) | 2 |
| Bad Subject (Buy Xanax) | 1 |
| Bad From (FBInCIAnNSATerroristSlayer@yahoo.com) | 1 |
| TOTAL: 5 | 20 |
Miscellaneous innd statistics [Top 10]:
| Event | Server | Number |
|---|---|---|
| Including strange strings | ||
| feed1.usenet.blueworldhosting.com | 352 | |
| TOTAL: 1 | 352 | |
| TOTAL: 1 | 352 | |
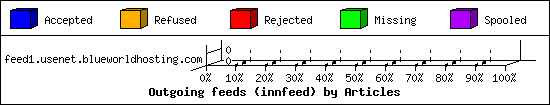
Outgoing Feeds (innfeed) by Articles:
| Server | Offered | Taken | Refused | Reject | Miss | Spool | %Took | Elapsed | |
|---|---|---|---|---|---|---|---|---|---|
| 1 | feed1.usenet.blueworldhosting.com | 0 | 0 | 0 | 0 | 0 | 0 | 0% | 00:10:00 |
| TOTAL: 1 | 0 | 0 | 0 | 0 | 0 | 0 | 0% | 00:10:00 | |
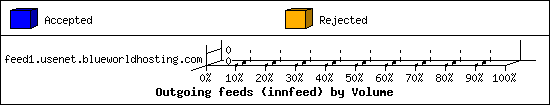
Outgoing Feeds (innfeed) by Volume:
| Server | AcceptVol | RejectVol | TotalVol | Volume/sec | Vol/Art | Elapsed | |
|---|---|---|---|---|---|---|---|
| 1 | feed1.usenet.blueworldhosting.com | 0.0 KB | 0.0 KB | 0.0 KB | 0.0 KB/s | 0 | 00:10:00 |
| TOTAL: 1 | 0.0 KB | 0.0 KB | 0.0 KB | 0.0 KB/s | 0 | 00:10:00 | |
NNRP readership statistics:
| System | Conn | Arts | Size | Groups | Post | Rej | Elapsed | |
|---|---|---|---|---|---|---|---|---|
| 1 | 173.30.87.242 | 20 | 321 | 758.2 KB | 20 | 0 | 0 | 00:18:47 |
| 2 | 023-084-030-207.res.spectrum.com | 376 | 16 | 1.6 MB | 6 | 0 | 0 | 03:34:01 |
| 3 | 209.160.112.133 | 12 | 0 | 0.0 KB | 0 | 2933 | 0 | 02:01:42 |
| TOTAL: 3 | 408 | 337 | 2.4 MB | 26 | 2933 | 0 | 28:08:27 | |
NNRP readership statistics (by domain):
| System | Conn | Arts | Size | Groups | Post | Rej | Elapsed | |
|---|---|---|---|---|---|---|---|---|
| 1 | unresolved | 32 | 321 | 758.2 KB | 20 | 2933 | 0 | 02:20:30 |
| 2 | *.res.spectrum.com | 376 | 16 | 1.6 MB | 6 | 0 | 0 | 03:34:01 |
| 3 | *.stehlik.co.uk | 987 | 0 | 0.0 KB | 0 | 0 | 0 | 22:13:55 |
| TOTAL: 3 | 1395 | 337 | 2.4 MB | 26 | 2933 | 0 | 28:08:27 | |
NNRP auth users [Top 20]:
| User | Conn |
|---|---|
| jesse | 388 |
| TOTAL: 1 | 388 |
NNRP total resource statistics [Top 20]:
| System | User(ms) | System(ms) | Idle(ms) | Elapsed |
|---|---|---|---|---|
| toma-03.stehlik.co.uk | 186.018 | 61.220 | 0.000 | 22:13:55 |
| 023-084-030-207.res.spectrum.com | 28.916 | 5.121 | 1.994 | 03:34:01 |
| 209.160.112.133 | 70.782 | 61.455 | 0.056 | 02:01:42 |
| 173.30.87.242 | 8.330 | 2.974 | 0.000 | 00:18:47 |
| TOTAL: 4 | 294.046 | 130.770 | 2.050 | 28:08:27 |
Curious NNRP server explorers [Top 20]:
| System | Conn |
|---|---|
| toma-03.stehlik.co.uk | 987 |
| TOTAL: 1 | 987 |
NNRP client timeouts [Top 20]:
| System | Conn | Peer |
|---|---|---|
| 023-084-030-207.res.spectrum.com | 375 | 375 |
| TOTAL: 1 | 375 | 375 |
Newsgroup request counts (by hierarchy):
| Hierarchy | Count | Pct | |
|---|---|---|---|
| 1 | rec | 321 | 97.9% |
| 2 | alt | 7 | 2.1% |
| TOTAL: 2 | 328 | 100.0% | |
Newsgroup request counts (by newsgroup) [Top 100]:
| Newsgroup | Count | |
|---|---|---|
| 1 | rec.food.cooking | 321 |
| 2 | alt.binaries.e-book.magazines | 4 |
| 3 | alt.binaries.e-books | 3 |
| TOTAL: 3 | 328 | |