Log entries by program:
| Program name | Lines | %Lines | Size | %Size |
|---|---|---|---|---|
| inn | 74743 | 54.9% | 8.0 MB | 59.8% |
| nnrpd | 59847 | 44.0% | 5.2 MB | 38.7% |
| innd | 1404 | 1.0% | 190.8 KB | 1.4% |
| innfeed | 159 | 0.1% | 14.6 KB | 0.1% |
| nocem | 8 | 0.0% | 0.7 KB | 0.0% |
| controlchan | 1 | 0.0% | 0.1 KB | 0.0% |
| TOTAL: 6 | 136162 | 100.0% | 13.4 MB | 100.0% |
History cache:
| Reason | Count | %Count |
|---|---|---|
| Do not exist | 74346 | 99.1% |
| Negative hits | 652 | 0.9% |
| Positive hits | 27 | 0.0% |
| Cache misses | 7 | 0.0% |
| TOTAL: 4 | 75032 | 100.0% |
INND timer:
| Code region | Time | Pct | Invoked | Min(ms) | Avg(ms) | Max(ms) |
|---|---|---|---|---|---|---|
| article cancel | 00:00:00.970 | 0.0% | 111 | 0.000 | 8.739 | 36.000 |
| article cleanup | 00:00:00.657 | 0.0% | 74382 | 0.000 | 0.009 | 0.059 |
| article logging | 00:00:01.103 | 0.0% | 74713 | 0.000 | 0.015 | 0.071 |
| article parse | 00:00:43.929 | 0.1% | 4024135 | 0.000 | 0.011 | 0.027 |
| article write | 00:30:10.038 | 2.1% | 74062 | 4.899 | 24.439 | 43.707 |
| artlog/artcncl | 00:00:00.001 | 0.0% | 31 | 0.000 | 0.032 | 0.500 |
| artlog/artparse | 00:00:00.000 | 0.0% | 0 | 0.000 | 0.000 | 0.000 |
| data move | 00:00:05.316 | 0.0% | 4492640 | 0.000 | 0.001 | 0.009 |
| hisgrep/artcncl | 00:00:00.377 | 0.0% | 142 | 0.000 | 2.655 | 15.200 |
| hishave/artcncl | 00:00:00.000 | 0.0% | 34 | 0.000 | 0.000 | 0.000 |
| history grep | 00:00:00.000 | 0.0% | 0 | 0.000 | 0.000 | 0.000 |
| history lookup | 00:00:18.628 | 0.0% | 75034 | 0.140 | 0.248 | 0.534 |
| history sync | 00:00:02.332 | 0.0% | 322 | 0.000 | 7.242 | 11.750 |
| history write | 00:01:24.456 | 0.1% | 74382 | 0.549 | 1.135 | 1.530 |
| hiswrite/artcncl | 00:00:00.000 | 0.0% | 0 | 0.000 | 0.000 | 0.000 |
| idle | 23:08:29.602 | 96.4% | 4014802 | 0.927 | 20.751 | 9369.734 |
| nntp read | 00:01:37.017 | 0.1% | 4014613 | 0.000 | 0.024 | 0.075 |
| overview write | 00:00:26.607 | 0.0% | 74062 | 0.126 | 0.359 | 6.795 |
| perl filter | 00:00:06.970 | 0.0% | 74280 | 0.000 | 0.094 | 0.174 |
| python filter | 00:16:33.596 | 1.1% | 74382 | 0.722 | 13.358 | 26.880 |
| site send | 00:00:02.102 | 0.0% | 74115 | 0.000 | 0.028 | 0.095 |
| TOTAL: 24:00:37.720 | 24:00:03.701 | 100.0% | - | - | - | - |
INNfeed timer:
| Code region | Time | Pct | Invoked | Min(ms) | Avg(ms) | Max(ms) |
|---|---|---|---|---|---|---|
| article new | 00:00:00.000 | 0.0% | 0 | 0.000 | 0.000 | 0.000 |
| article prepare | 00:00:00.000 | 0.0% | 0 | 0.000 | 0.000 | 0.000 |
| article read | 00:00:00.000 | 0.0% | 0 | 0.000 | 0.000 | 0.000 |
| backlog stats | 00:00:00.005 | 0.0% | 3728 | 0.000 | 0.001 | 0.077 |
| callbacks | 00:00:00.000 | 0.0% | 0 | 0.000 | 0.000 | 0.000 |
| data read | 00:00:00.000 | 0.0% | 3 | 0.000 | 0.000 | 0.000 |
| data write | 00:00:00.000 | 0.0% | 3 | 0.000 | 0.000 | 0.000 |
| idle | 23:55:05.720 | 100.0% | 3728 | 17651.088 | 23097.028 | 24204.000 |
| status file | 00:00:00.001 | 0.0% | 6 | 0.000 | 0.167 | 0.500 |
| TOTAL: 23:55:05.768 | 23:55:05.726 | 100.0% | - | - | - | - |
nnrpd timer:
| Code region | Time | Pct | Invoked | Min(ms) | Avg(ms) | Max(ms) |
|---|---|---|---|---|---|---|
| hisgrep | 00:00:00.009 | 0.0% | 1 | 9.000 | 9.000 | 9.000 |
| idle | 00:00:00.000 | 0.0% | 0 | 0.000 | 0.000 | 0.000 |
| newnews | 00:00:00.000 | 0.0% | 0 | 0.000 | 0.000 | 0.000 |
| nntpwrite | 00:27:58.448 | 2.1% | 13260836 | 0.000 | 0.127 | 157.438 |
| readart | 00:00:00.053 | 0.0% | 1 | 53.000 | 53.000 | 53.000 |
| TOTAL: 22:40:42.404 | 00:27:58.510 | 2.1% | - | - | - | - |
Control commands to INND:
| Command | Number |
|---|---|
| flush | 5 |
| flushlogs | 2 |
| go | 1 |
| logmode | 2 |
| mode | 149 |
| name | 2 |
| pause | 1 |
| paused | 1 |
| reload | 2 |
| renumber | 1 |
| TOTAL: 10 | 166 |
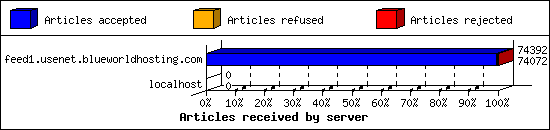
Incoming Feeds (INN):
| Server | Connects | Offered | Taken | Refused | Reject | %Accpt | Elapsed | |
|---|---|---|---|---|---|---|---|---|
| 1 | feed1.usenet.blueworldhosting.com | 17 | 74392 | 74072 | 0 | 320 | 99% | 25:29:50 |
| 2 | localhost | 2 | 0 | 0 | 0 | 0 | 0% | 00:00:00 |
| TOTAL: 2 | 19 | 74392 | 74072 | 0 | 320 | 99% | 25:29:50 | |
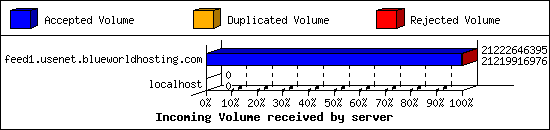
Incoming Volume (INN):
| Server | AcceptVol | DupVol | RejVol | TotalVol | %Acc | Vol/Art | |
|---|---|---|---|---|---|---|---|
| 1 | feed1.usenet.blueworldhosting.com | 19.8 GB | 0.0 KB | 2.6 MB | 19.8 GB | 99% | 278.6 KB |
| 2 | localhost | 0.0 KB | 0.0 KB | 0.0 KB | 0.0 KB | 0% | 0 |
| TOTAL: 2 | 19.8 GB | 0.0 KB | 2.6 MB | 19.8 GB | 99% | 278.6 KB | |
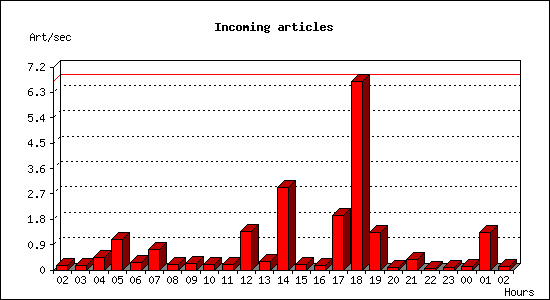
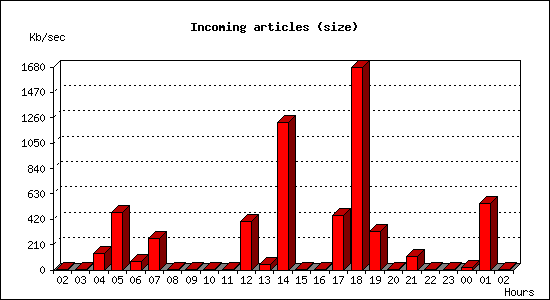
Incoming articles:
| Date | Articles | %Arts | Art/sec | Size | %Size | KB/sec |
|---|---|---|---|---|---|---|
| Sep 28 02:30:00 - 02:59:59 | 269 | 0.4% | 0.15 | 916.4 KB | 0.0% | 0.51 |
| Sep 28 03:00:00 - 03:59:59 | 549 | 0.7% | 0.15 | 1.3 MB | 0.0% | 0.38 |
| Sep 28 04:00:00 - 04:59:59 | 1557 | 2.1% | 0.43 | 477.9 MB | 2.4% | 135.94 |
| Sep 28 05:00:00 - 05:59:59 | 3938 | 5.3% | 1.09 | 1.6 GB | 8.3% | 479.27 |
| Sep 28 06:00:00 - 06:59:59 | 974 | 1.3% | 0.27 | 238.9 MB | 1.2% | 67.94 |
| Sep 28 07:00:00 - 07:59:59 | 2637 | 3.6% | 0.73 | 929.7 MB | 4.6% | 264.44 |
| Sep 28 08:00:00 - 08:59:59 | 734 | 1.0% | 0.20 | 4.3 MB | 0.0% | 1.22 |
| Sep 28 09:00:00 - 09:59:59 | 891 | 1.2% | 0.25 | 2.7 MB | 0.0% | 0.76 |
| Sep 28 10:00:00 - 10:59:59 | 761 | 1.0% | 0.21 | 10.0 MB | 0.0% | 2.83 |
| Sep 28 11:00:00 - 11:59:59 | 676 | 0.9% | 0.19 | 3.9 MB | 0.0% | 1.10 |
| Sep 28 12:00:00 - 12:59:59 | 4889 | 6.6% | 1.36 | 1.4 GB | 7.0% | 404.17 |
| Sep 28 13:00:00 - 13:59:59 | 1088 | 1.5% | 0.30 | 151.5 MB | 0.7% | 43.10 |
| Sep 28 14:00:00 - 14:59:59 | 10489 | 14.2% | 2.91 | 4.2 GB | 21.2% | 1221.45 |
| Sep 28 15:00:00 - 15:59:59 | 679 | 0.9% | 0.19 | 12.9 MB | 0.1% | 3.67 |
| Sep 28 16:00:00 - 16:59:59 | 516 | 0.7% | 0.14 | 1.7 MB | 0.0% | 0.50 |
| Sep 28 17:00:00 - 17:59:59 | 6922 | 9.3% | 1.92 | 1.6 GB | 7.9% | 454.27 |
| Sep 28 18:00:00 - 18:59:59 | 24104 | 32.5% | 6.70 | 5.8 GB | 29.1% | 1674.93 |
| Sep 28 19:00:00 - 19:59:59 | 4745 | 6.4% | 1.32 | 1.1 GB | 5.5% | 316.79 |
| Sep 28 20:00:00 - 20:59:59 | 277 | 0.4% | 0.08 | 1.2 MB | 0.0% | 0.34 |
| Sep 28 21:00:00 - 21:59:59 | 1355 | 1.8% | 0.38 | 400.0 MB | 2.0% | 113.77 |
| Sep 28 22:00:00 - 22:59:59 | 219 | 0.3% | 0.06 | 1.4 MB | 0.0% | 0.39 |
| Sep 28 23:00:00 - 23:59:59 | 328 | 0.4% | 0.09 | 2.1 MB | 0.0% | 0.60 |
| Sep 29 00:00:00 - 00:59:59 | 395 | 0.5% | 0.11 | 59.3 MB | 0.3% | 16.86 |
| Sep 29 01:00:00 - 01:59:59 | 4824 | 6.5% | 1.34 | 1.9 GB | 9.6% | 551.06 |
| Sep 29 02:00:00 - 02:30:00 | 245 | 0.3% | 0.14 | 904.7 KB | 0.0% | 0.50 |
| TOTAL: 24:00:00 | 74061 | 100.0% | 0.86 | 19.8 GB | 100.0% | 239.84 |
Sites sending bad articles:
| Server | Total | Group | Dist | Duplic | Unapp | TooOld | Site | Line | Other | |
|---|---|---|---|---|---|---|---|---|---|---|
| 1 | feed1.usenet.blueworldhosting.com | 651 | 218 | 0 | 0 | 2 | 0 | 0 | 0 | 431 |
| TOTAL: 1 | 651 | 218 | 0 | 0 | 2 | 0 | 0 | 0 | 431 | |
Unwanted newsgroups [Top 20]:
| Newsgroup | Count |
|---|---|
| finet.binaries.keskustelu | 26 |
| al.binaries.test | 19 |
| alt.binaries.pictures.wallpaper | 17 |
| alt.binaries.pictures.scenic | 16 |
| talk.generic.ua.ws | 13 |
| alt.binaries.pictures.teen-starlets | 9 |
| alt.binaries.sounds.lossless | 8 |
| alt.binaries.pictures.nude.celebrities.fake | 8 |
| alt.binaries.test.yenc | 7 |
| panix.chat | 7 |
| alt.binaries.adan | 6 |
| wolfsburg.test | 5 |
| alt.binaries.sounds.mp3.new-age | 4 |
| alt.binaries.ebooks.flood | 4 |
| alt.binaries.3d.poser | 3 |
| alt.binaries.nospam.female.bodyhair | 3 |
| alt.binaries.e-books.flood | 3 |
| alt.binaries.sounds.lossless.jazz | 3 |
| alt.binaries.comics.dcp | 3 |
| alt.binaries.multimedia.videos.music | 2 |
| TOTAL: 62 | 218 |
Supposedly-moderated groups with unmoderated postings [Top 20]:
| Groups | Count |
|---|---|
| alt.religion.psychedelic.moderated | 2 |
| TOTAL: 1 | 2 |
INND Python filter [Top 20]:
| Reason | Count |
|---|---|
| EMP Body Reject | 66 |
| Bad From (FBInCIAnNSATerroristSlayer@yahoo.com) | 26 |
| Bad From (PHARMA GRADE) | 3 |
| Bad Subject (Buy GBL) | 2 |
| Bad Subject (Solution manual ) | 2 |
| Bad Subject (Solution Manual ) | 1 |
| Bad Subject (Buy adderall) | 1 |
| Bad From (dr.jamesmoore202@gmail.com) | 1 |
| TOTAL: 8 | 102 |
NoCeM on Spool:
| Id | Good | Bad | Unique | Total |
|---|---|---|---|---|
| bleachbot@httrack.com | 3 | 0 | 3 | 3 |
| TOTAL: 1 | 3 | 0 | 3 | 3 |
Miscellaneous innd statistics [Top 10]:
| Event | Server | Number |
|---|---|---|
| Including strange strings | ||
| feed1.usenet.blueworldhosting.com | 329 | |
| TOTAL: 1 | 329 | |
| TOTAL: 1 | 329 | |
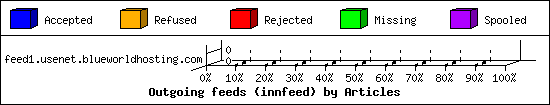
Outgoing Feeds (innfeed) by Articles:
| Server | Offered | Taken | Refused | Reject | Miss | Spool | %Took | Elapsed | |
|---|---|---|---|---|---|---|---|---|---|
| 1 | feed1.usenet.blueworldhosting.com | 0 | 0 | 0 | 0 | 0 | 0 | 0% | 00:10:00 |
| TOTAL: 1 | 0 | 0 | 0 | 0 | 0 | 0 | 0% | 00:10:00 | |
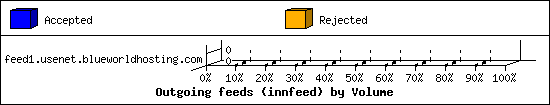
Outgoing Feeds (innfeed) by Volume:
| Server | AcceptVol | RejectVol | TotalVol | Volume/sec | Vol/Art | Elapsed | |
|---|---|---|---|---|---|---|---|
| 1 | feed1.usenet.blueworldhosting.com | 0.0 KB | 0.0 KB | 0.0 KB | 0.0 KB/s | 0 | 00:10:00 |
| TOTAL: 1 | 0.0 KB | 0.0 KB | 0.0 KB | 0.0 KB/s | 0 | 00:10:00 | |
NNRP readership statistics:
| System | Conn | Arts | Size | Groups | Post | Rej | Elapsed | |
|---|---|---|---|---|---|---|---|---|
| 1 | 023-084-030-207.res.spectrum.com | 20 | 1 | 1.2 KB | 1 | 0 | 0 | 00:09:50 |
| TOTAL: 1 | 20 | 1 | 1.2 KB | 1 | 0 | 0 | 22:40:37 | |
NNRP readership statistics (by domain):
| System | Conn | Arts | Size | Groups | Post | Rej | Elapsed | |
|---|---|---|---|---|---|---|---|---|
| 1 | *.res.spectrum.com | 20 | 1 | 1.2 KB | 1 | 0 | 0 | 00:09:50 |
| 2 | *.stehlik.co.uk | 968 | 0 | 0.0 KB | 0 | 0 | 0 | 22:30:46 |
| TOTAL: 2 | 988 | 1 | 1.2 KB | 1 | 0 | 0 | 22:40:37 | |
NNRP auth users [Top 20]:
| User | Conn |
|---|---|
| jesse | 20 |
| TOTAL: 1 | 20 |
NNRP total resource statistics [Top 20]:
| System | User(ms) | System(ms) | Idle(ms) | Elapsed |
|---|---|---|---|---|
| toma-03.stehlik.co.uk | 183.293 | 62.358 | 0.000 | 22:30:46 |
| 023-084-030-207.res.spectrum.com | 1.968 | 0.411 | 0.097 | 00:09:50 |
| TOTAL: 2 | 185.261 | 62.769 | 0.097 | 22:40:37 |
Curious NNRP server explorers [Top 20]:
| System | Conn |
|---|---|
| toma-03.stehlik.co.uk | 968 |
| TOTAL: 1 | 968 |
NNRP client timeouts [Top 20]:
| System | Conn | Peer |
|---|---|---|
| 023-084-030-207.res.spectrum.com | 20 | 20 |
| toma-03.stehlik.co.uk | 1 | 1 |
| TOTAL: 2 | 21 | 21 |
Newsgroup request counts (by hierarchy):
| Hierarchy | Count | Pct | |
|---|---|---|---|
| 1 | alt | 1 | 100.0% |
| TOTAL: 1 | 1 | 100.0% | |
Newsgroup request counts (by newsgroup) [Top 100]:
| Newsgroup | Count | |
|---|---|---|
| 1 | alt.binaries.e-book.magazines | 1 |
| TOTAL: 1 | 1 | |