Log entries by program:
| Program name | Lines | %Lines | Size | %Size |
|---|---|---|---|---|
| nnrpd | 67974 | 57.9% | 5.9 MB | 51.9% |
| inn | 48110 | 41.0% | 5.3 MB | 46.5% |
| innd | 1196 | 1.0% | 171.5 KB | 1.5% |
| innfeed | 158 | 0.1% | 14.3 KB | 0.1% |
| nocem | 1 | 0.0% | 0.0 KB | 0.0% |
| controlchan | 1 | 0.0% | 0.1 KB | 0.0% |
| TOTAL: 6 | 117440 | 100.0% | 11.3 MB | 100.0% |
History cache:
| Reason | Count | %Count |
|---|---|---|
| Do not exist | 47727 | 98.7% |
| Negative hits | 621 | 1.3% |
| Positive hits | 19 | 0.0% |
| Cache misses | 4 | 0.0% |
| TOTAL: 4 | 48371 | 100.0% |
INND timer:
| Code region | Time | Pct | Invoked | Min(ms) | Avg(ms) | Max(ms) |
|---|---|---|---|---|---|---|
| article cancel | 00:00:01.388 | 0.0% | 81 | 0.000 | 17.136 | 250.667 |
| article cleanup | 00:00:00.449 | 0.0% | 47808 | 0.000 | 0.009 | 0.060 |
| article logging | 00:00:00.733 | 0.0% | 48097 | 0.000 | 0.015 | 0.065 |
| article parse | 00:00:33.077 | 0.0% | 3156473 | 0.000 | 0.010 | 0.040 |
| article write | 00:21:48.747 | 1.5% | 47540 | 4.178 | 27.529 | 43.800 |
| artlog/artcncl | 00:00:00.000 | 0.0% | 23 | 0.000 | 0.000 | 0.000 |
| artlog/artparse | 00:00:00.000 | 0.0% | 0 | 0.000 | 0.000 | 0.000 |
| data move | 00:00:04.021 | 0.0% | 3450446 | 0.000 | 0.001 | 0.011 |
| hisgrep/artcncl | 00:00:00.805 | 0.0% | 104 | 0.000 | 7.740 | 133.400 |
| hishave/artcncl | 00:00:00.000 | 0.0% | 23 | 0.000 | 0.000 | 0.000 |
| history grep | 00:00:00.000 | 0.0% | 0 | 0.000 | 0.000 | 0.000 |
| history lookup | 00:00:14.002 | 0.0% | 48429 | 0.095 | 0.289 | 0.546 |
| history sync | 00:00:02.616 | 0.0% | 323 | 0.000 | 8.099 | 11.000 |
| history write | 00:00:57.043 | 0.1% | 47808 | 0.595 | 1.193 | 1.384 |
| hiswrite/artcncl | 00:00:00.000 | 0.0% | 0 | 0.000 | 0.000 | 0.000 |
| idle | 23:22:27.768 | 97.3% | 3148777 | 0.715 | 26.724 | 11764.373 |
| nntp read | 00:01:12.955 | 0.1% | 3148657 | 0.000 | 0.023 | 0.051 |
| overview write | 00:00:18.908 | 0.0% | 47540 | 0.113 | 0.398 | 3.798 |
| perl filter | 00:00:05.204 | 0.0% | 47760 | 0.000 | 0.109 | 0.160 |
| python filter | 00:12:24.321 | 0.9% | 47808 | 0.733 | 15.569 | 26.824 |
| site send | 00:00:01.490 | 0.0% | 47604 | 0.000 | 0.031 | 0.151 |
| TOTAL: 24:00:41.396 | 24:00:13.527 | 100.0% | - | - | - | - |
INNfeed timer:
| Code region | Time | Pct | Invoked | Min(ms) | Avg(ms) | Max(ms) |
|---|---|---|---|---|---|---|
| article new | 00:00:00.000 | 0.0% | 0 | 0.000 | 0.000 | 0.000 |
| article prepare | 00:00:00.000 | 0.0% | 0 | 0.000 | 0.000 | 0.000 |
| article read | 00:00:00.000 | 0.0% | 0 | 0.000 | 0.000 | 0.000 |
| backlog stats | 00:00:00.005 | 0.0% | 3723 | 0.000 | 0.001 | 0.077 |
| callbacks | 00:00:00.000 | 0.0% | 0 | 0.000 | 0.000 | 0.000 |
| data read | 00:00:00.000 | 0.0% | 3 | 0.000 | 0.000 | 0.000 |
| data write | 00:00:00.000 | 0.0% | 3 | 0.000 | 0.000 | 0.000 |
| idle | 23:56:11.860 | 100.0% | 3723 | 17675.382 | 23145.813 | 26216.304 |
| status file | 00:00:00.002 | 0.0% | 6 | 0.000 | 0.333 | 0.500 |
| TOTAL: 23:56:11.924 | 23:56:11.867 | 100.0% | - | - | - | - |
nnrpd timer:
| Code region | Time | Pct | Invoked | Min(ms) | Avg(ms) | Max(ms) |
|---|---|---|---|---|---|---|
| idle | 00:00:00.000 | 0.0% | 0 | 0.000 | 0.000 | 0.000 |
| newnews | 00:00:00.000 | 0.0% | 0 | 0.000 | 0.000 | 0.000 |
| nntpwrite | 00:27:48.885 | 2.1% | 13149105 | 0.000 | 0.127 | 1.000 |
| TOTAL: 22:32:48.568 | 00:27:48.885 | 2.1% | - | - | - | - |
Control commands to INND:
| Command | Number |
|---|---|
| flush | 5 |
| flushlogs | 2 |
| go | 1 |
| logmode | 2 |
| mode | 149 |
| name | 2 |
| pause | 1 |
| paused | 1 |
| reload | 2 |
| renumber | 1 |
| TOTAL: 10 | 166 |
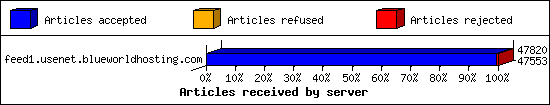
Incoming Feeds (INN):
| Server | Connects | Offered | Taken | Refused | Reject | %Accpt | Elapsed | |
|---|---|---|---|---|---|---|---|---|
| 1 | feed1.usenet.blueworldhosting.com | 25 | 47820 | 47553 | 0 | 267 | 99% | 25:49:47 |
| TOTAL: 1 | 25 | 47820 | 47553 | 0 | 267 | 99% | 25:49:47 | |
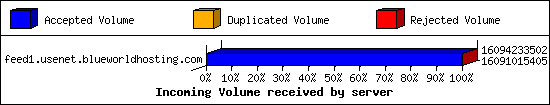
Incoming Volume (INN):
| Server | AcceptVol | DupVol | RejVol | TotalVol | %Acc | Vol/Art | |
|---|---|---|---|---|---|---|---|
| 1 | feed1.usenet.blueworldhosting.com | 15.0 GB | 0.0 KB | 3.1 MB | 15.0 GB | 99% | 328.7 KB |
| TOTAL: 1 | 15.0 GB | 0.0 KB | 3.1 MB | 15.0 GB | 99% | 328.7 KB | |
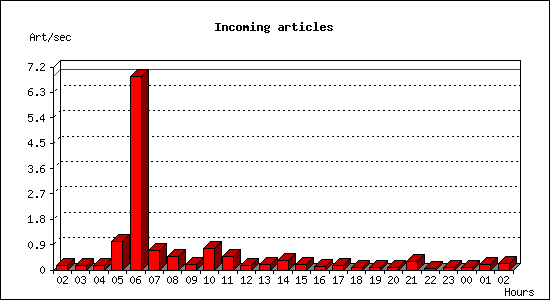
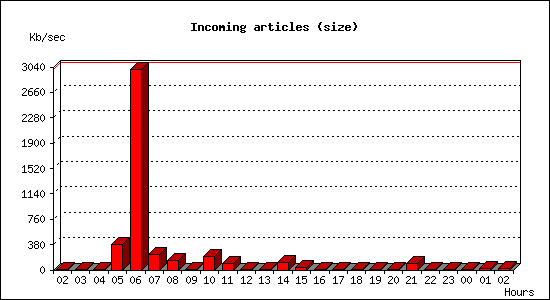
Incoming articles:
| Date | Articles | %Arts | Art/sec | Size | %Size | KB/sec |
|---|---|---|---|---|---|---|
| Oct 6 02:30:00 - 02:59:59 | 319 | 0.7% | 0.18 | 945.1 KB | 0.0% | 0.53 |
| Oct 6 03:00:00 - 03:59:59 | 617 | 1.3% | 0.17 | 1.9 MB | 0.0% | 0.55 |
| Oct 6 04:00:00 - 04:59:59 | 588 | 1.2% | 0.16 | 2.8 MB | 0.0% | 0.80 |
| Oct 6 05:00:00 - 05:59:59 | 3667 | 7.7% | 1.02 | 1.3 GB | 8.9% | 388.46 |
| Oct 6 06:00:00 - 06:59:59 | 24714 | 52.0% | 6.87 | 10.3 GB | 68.7% | 2996.55 |
| Oct 6 07:00:00 - 07:59:59 | 2432 | 5.1% | 0.68 | 818.9 MB | 5.3% | 232.93 |
| Oct 6 08:00:00 - 08:59:59 | 1716 | 3.6% | 0.48 | 476.2 MB | 3.1% | 135.45 |
| Oct 6 09:00:00 - 09:59:59 | 661 | 1.4% | 0.18 | 2.9 MB | 0.0% | 0.81 |
| Oct 6 10:00:00 - 10:59:59 | 2729 | 5.7% | 0.76 | 710.0 MB | 4.6% | 201.96 |
| Oct 6 11:00:00 - 11:59:59 | 1665 | 3.5% | 0.46 | 339.4 MB | 2.2% | 96.55 |
| Oct 6 12:00:00 - 12:59:59 | 633 | 1.3% | 0.18 | 2.6 MB | 0.0% | 0.73 |
| Oct 6 13:00:00 - 13:59:59 | 678 | 1.4% | 0.19 | 3.4 MB | 0.0% | 0.98 |
| Oct 6 14:00:00 - 14:59:59 | 1239 | 2.6% | 0.34 | 417.9 MB | 2.7% | 118.88 |
| Oct 6 15:00:00 - 15:59:59 | 742 | 1.6% | 0.21 | 112.9 MB | 0.7% | 32.12 |
| Oct 6 16:00:00 - 16:59:59 | 508 | 1.1% | 0.14 | 42.1 MB | 0.3% | 11.97 |
| Oct 6 17:00:00 - 17:59:59 | 553 | 1.2% | 0.15 | 6.6 MB | 0.0% | 1.88 |
| Oct 6 18:00:00 - 18:59:59 | 351 | 0.7% | 0.10 | 4.5 MB | 0.0% | 1.28 |
| Oct 6 19:00:00 - 19:59:59 | 300 | 0.6% | 0.08 | 919.9 KB | 0.0% | 0.26 |
| Oct 6 20:00:00 - 20:59:59 | 273 | 0.6% | 0.08 | 24.8 MB | 0.2% | 7.07 |
| Oct 6 21:00:00 - 21:59:59 | 1108 | 2.3% | 0.31 | 332.5 MB | 2.2% | 94.58 |
| Oct 6 22:00:00 - 22:59:59 | 252 | 0.5% | 0.07 | 2.9 MB | 0.0% | 0.84 |
| Oct 6 23:00:00 - 23:59:59 | 324 | 0.7% | 0.09 | 2.2 MB | 0.0% | 0.63 |
| Oct 7 00:00:00 - 00:59:59 | 322 | 0.7% | 0.09 | 1.3 MB | 0.0% | 0.36 |
| Oct 7 01:00:00 - 01:59:59 | 703 | 1.5% | 0.20 | 99.5 MB | 0.6% | 28.30 |
| Oct 7 02:00:00 - 02:30:00 | 440 | 0.9% | 0.24 | 37.8 MB | 0.2% | 21.51 |
| TOTAL: 24:00:00 | 47534 | 100.0% | 0.55 | 15.0 GB | 100.0% | 181.87 |
Sites sending bad articles:
| Server | Total | Group | Dist | Duplic | Unapp | TooOld | Site | Line | Other | |
|---|---|---|---|---|---|---|---|---|---|---|
| 1 | feed1.usenet.blueworldhosting.com | 553 | 218 | 0 | 0 | 1 | 0 | 0 | 0 | 334 |
| TOTAL: 1 | 553 | 218 | 0 | 0 | 1 | 0 | 0 | 0 | 334 | |
Unwanted newsgroups [Top 20]:
| Newsgroup | Count |
|---|---|
| finet.binaries.keskustelu | 27 |
| alt.binaries.pictures.scenic | 17 |
| alt.binaries.pictures.teen-starlets | 16 |
| al.binaries.test | 15 |
| alt.binaries.nospam.female.bodyhair.pubes | 15 |
| alt.binaries.pictures.nude.celebrities.fake | 14 |
| alt.binaries.sacd.iso | 11 |
| talk.generic.ua.ws | 10 |
| alt.binaries.test.yenc | 9 |
| alt.binaries.howard-stern | 5 |
| alt.binaries.xxx | 4 |
| alt.binaries.pictures.rail | 4 |
| alt.binaries.movies.erotica | 4 |
| alt.binaries.nospam.female.bodyhair | 4 |
| alt.binaries.drwho | 4 |
| alt.binaries.e-books.flood | 3 |
| alt.binaries.pictures.erotica.vintage | 3 |
| alt.binaries.pictures.earlmiller | 3 |
| alt.binaries.sounds.lossless | 2 |
| borland.public.delphi.internet.winsock | 2 |
| TOTAL: 59 | 218 |
Supposedly-moderated groups with unmoderated postings [Top 20]:
| Groups | Count |
|---|---|
| bit.listserv.catholic | 1 |
| TOTAL: 1 | 1 |
INND Python filter [Top 20]:
| Reason | Count |
|---|---|
| Bad From (hclaudioblanco@gmail.com) | 13 |
| Bad From (PHARMA GRADE) | 8 |
| EMP Body Reject | 6 |
| Bad From (FBInCIAnNSATerroristSlayer@yahoo.com) | 5 |
| Bad Subject (Solution Manual ) | 5 |
| Bad Subject (Buy Magic Mushrooms) | 4 |
| Bad From (dr.jamesmoore202@gmail.com) | 3 |
| Bad Subject (Solution manual ) | 1 |
| AUK Bad Crosspost | 1 |
| Bad Subject (Buy adderall) | 1 |
| Bad Subject (Buy Adderall) | 1 |
| TOTAL: 11 | 48 |
Miscellaneous innd statistics [Top 10]:
| Event | Server | Number |
|---|---|---|
| Including strange strings | ||
| feed1.usenet.blueworldhosting.com | 286 | |
| TOTAL: 1 | 286 | |
| TOTAL: 1 | 286 | |
Outgoing Feeds (innfeed) by Articles:
| Server | Offered | Taken | Refused | Reject | Miss | Spool | %Took | Elapsed | |
|---|---|---|---|---|---|---|---|---|---|
| 1 | feed1.usenet.blueworldhosting.com | 0 | 0 | 0 | 0 | 0 | 0 | 0% | 00:10:00 |
| TOTAL: 1 | 0 | 0 | 0 | 0 | 0 | 0 | 0% | 00:10:00 | |
Outgoing Feeds (innfeed) by Volume:
| Server | AcceptVol | RejectVol | TotalVol | Volume/sec | Vol/Art | Elapsed | |
|---|---|---|---|---|---|---|---|
| 1 | feed1.usenet.blueworldhosting.com | 0.0 KB | 0.0 KB | 0.0 KB | 0.0 KB/s | 0 | 00:10:00 |
| TOTAL: 1 | 0.0 KB | 0.0 KB | 0.0 KB | 0.0 KB/s | 0 | 00:10:00 | |
NNRP readership statistics:
| System | Conn | Arts | Size | Groups | Post | Rej | Elapsed | |
|---|---|---|---|---|---|---|---|---|
| 1 | toma-03.stehlik.co.uk | 992 | 0 | 0.0 KB | 0 | 0 | 0 | 22:31:47 |
| 2 | poised.monitoring.internet-measurement.com | 1 | 0 | 0.0 KB | 0 | 0 | 0 | 00:00:00 |
| 3 | lustrous.monitoring.internet-measurement.com | 1 | 0 | 0.0 KB | 0 | 0 | 0 | 00:00:00 |
| 4 | 104.156.155.15 | 96 | 0 | 0.0 KB | 0 | 0 | 0 | 00:00:47 |
| 5 | tranquil.monitoring.internet-measurement.com | 1 | 0 | 0.0 KB | 0 | 0 | 0 | 00:00:00 |
| 6 | valiant.monitoring.internet-measurement.com | 1 | 0 | 0.0 KB | 0 | 0 | 0 | 00:00:00 |
| 7 | intuitive.monitoring.internet-measurement.com | 1 | 0 | 0.0 KB | 0 | 0 | 0 | 00:00:00 |
| 8 | successful.monitoring.internet-measurement.com | 1 | 0 | 0.0 KB | 0 | 0 | 0 | 00:00:00 |
| 9 | cool.monitoring.internet-measurement.com | 1 | 0 | 0.0 KB | 0 | 0 | 0 | 00:00:00 |
| 10 | joyful.monitoring.internet-measurement.com | 1 | 0 | 0.0 KB | 0 | 0 | 0 | 00:00:06 |
| 11 | stellar.monitoring.internet-measurement.com | 1 | 0 | 0.0 KB | 0 | 0 | 0 | 00:00:00 |
| 12 | fruitful.monitoring.internet-measurement.com | 1 | 0 | 0.0 KB | 0 | 0 | 0 | 00:00:00 |
| 13 | stunning.monitoring.internet-measurement.com | 1 | 0 | 0.0 KB | 0 | 0 | 0 | 00:00:00 |
| TOTAL: 13 | 1099 | 0 | 0.0 KB | 0 | 0 | 0 | 22:32:42 | |
NNRP readership statistics (by domain):
| System | Conn | Arts | Size | Groups | Post | Rej | Elapsed | |
|---|---|---|---|---|---|---|---|---|
| 1 | *.monitoring.internet-measurement.com | 11 | 0 | 0.0 KB | 0 | 0 | 0 | 00:00:07 |
| 2 | unresolved | 96 | 0 | 0.0 KB | 0 | 0 | 0 | 00:00:47 |
| 3 | *.stehlik.co.uk | 992 | 0 | 0.0 KB | 0 | 0 | 0 | 22:31:47 |
| TOTAL: 3 | 1099 | 0 | 0.0 KB | 0 | 0 | 0 | 22:32:42 | |
NNRP total resource statistics [Top 20]:
| System | User(ms) | System(ms) | Idle(ms) | Elapsed |
|---|---|---|---|---|
| toma-03.stehlik.co.uk | 180.324 | 58.313 | 0.000 | 22:31:47 |
| 104.156.155.15 | 6.935 | 0.809 | 0.000 | 00:00:47 |
| joyful.monitoring.internet-measurement.com | 0.066 | 0.016 | 0.000 | 00:00:06 |
| intuitive.monitoring.internet-measurement.com | 0.075 | 0.000 | 0.000 | 00:00:00 |
| stellar.monitoring.internet-measurement.com | 0.071 | 0.008 | 0.000 | 00:00:00 |
| poised.monitoring.internet-measurement.com | 0.076 | 0.000 | 0.000 | 00:00:00 |
| TOTAL: 6 | 187.547 | 59.146 | 0.000 | 22:32:42 |
NNRP client timeouts [Top 20]:
| System | Conn | Peer |
|---|---|---|
| toma-03.stehlik.co.uk | 3 | 3 |
| TOTAL: 1 | 3 | 4 |