Log entries by program:
| Program name | Lines | %Lines | Size | %Size |
|---|---|---|---|---|
| inn | 72428 | 54.4% | 7.8 MB | 59.4% |
| nnrpd | 59378 | 44.6% | 5.2 MB | 39.2% |
| innd | 1267 | 1.0% | 177.6 KB | 1.3% |
| innfeed | 159 | 0.1% | 14.5 KB | 0.1% |
| nocem | 1 | 0.0% | 0.1 KB | 0.0% |
| controlchan | 1 | 0.0% | 0.1 KB | 0.0% |
| TOTAL: 6 | 133234 | 100.0% | 13.2 MB | 100.0% |
History cache:
| Reason | Count | %Count |
|---|---|---|
| Do not exist | 72029 | 99.1% |
| Negative hits | 657 | 0.9% |
| Positive hits | 22 | 0.0% |
| Cache misses | 7 | 0.0% |
| TOTAL: 4 | 72715 | 100.0% |
INND timer:
| Code region | Time | Pct | Invoked | Min(ms) | Avg(ms) | Max(ms) |
|---|---|---|---|---|---|---|
| article cancel | 00:00:00.312 | 0.0% | 64 | 0.000 | 4.875 | 34.000 |
| article cleanup | 00:00:00.693 | 0.0% | 72103 | 0.000 | 0.010 | 0.062 |
| article logging | 00:00:01.106 | 0.0% | 72391 | 0.000 | 0.015 | 0.044 |
| article parse | 00:01:03.255 | 0.1% | 6028771 | 0.000 | 0.010 | 0.026 |
| article write | 00:34:25.900 | 2.4% | 71822 | 2.987 | 28.764 | 43.766 |
| artlog/artcncl | 00:00:00.001 | 0.0% | 29 | 0.000 | 0.034 | 0.333 |
| artlog/artparse | 00:00:00.000 | 0.0% | 0 | 0.000 | 0.000 | 0.000 |
| data move | 00:00:07.444 | 0.0% | 6580838 | 0.000 | 0.001 | 0.014 |
| hisgrep/artcncl | 00:00:00.123 | 0.0% | 93 | 0.000 | 1.323 | 10.200 |
| hishave/artcncl | 00:00:00.000 | 0.0% | 29 | 0.000 | 0.000 | 0.000 |
| history grep | 00:00:00.000 | 0.0% | 0 | 0.000 | 0.000 | 0.000 |
| history lookup | 00:00:18.310 | 0.0% | 72760 | 0.149 | 0.252 | 0.405 |
| history sync | 00:00:01.792 | 0.0% | 333 | 1.000 | 5.381 | 11.000 |
| history write | 00:01:10.293 | 0.1% | 72103 | 0.515 | 0.975 | 1.619 |
| hiswrite/artcncl | 00:00:00.000 | 0.0% | 0 | 0.000 | 0.000 | 0.000 |
| idle | 22:56:30.328 | 95.5% | 6020796 | 0.876 | 13.718 | 9373.375 |
| nntp read | 00:02:20.001 | 0.2% | 6020580 | 0.000 | 0.023 | 0.048 |
| overview write | 00:00:25.106 | 0.0% | 71822 | 0.128 | 0.350 | 8.905 |
| perl filter | 00:00:08.991 | 0.0% | 72056 | 0.000 | 0.125 | 0.198 |
| python filter | 00:23:29.148 | 1.6% | 72103 | 0.650 | 19.544 | 28.984 |
| site send | 00:00:02.171 | 0.0% | 71860 | 0.000 | 0.030 | 0.332 |
| TOTAL: 24:00:38.774 | 24:00:04.974 | 100.0% | - | - | - | - |
INNfeed timer:
| Code region | Time | Pct | Invoked | Min(ms) | Avg(ms) | Max(ms) |
|---|---|---|---|---|---|---|
| article new | 00:00:00.000 | 0.0% | 0 | 0.000 | 0.000 | 0.000 |
| article prepare | 00:00:00.000 | 0.0% | 0 | 0.000 | 0.000 | 0.000 |
| article read | 00:00:00.000 | 0.0% | 0 | 0.000 | 0.000 | 0.000 |
| backlog stats | 00:00:00.004 | 0.0% | 3731 | 0.000 | 0.001 | 0.038 |
| callbacks | 00:00:00.000 | 0.0% | 0 | 0.000 | 0.000 | 0.000 |
| data read | 00:00:00.000 | 0.0% | 3 | 0.000 | 0.000 | 0.000 |
| data write | 00:00:00.000 | 0.0% | 3 | 0.000 | 0.000 | 0.000 |
| idle | 23:55:36.281 | 100.0% | 3731 | 17652.382 | 23086.647 | 24123.480 |
| status file | 00:00:00.003 | 0.0% | 6 | 0.500 | 0.500 | 0.500 |
| TOTAL: 23:55:36.326 | 23:55:36.288 | 100.0% | - | - | - | - |
nnrpd timer:
| Code region | Time | Pct | Invoked | Min(ms) | Avg(ms) | Max(ms) |
|---|---|---|---|---|---|---|
| hisgrep | 00:00:00.019 | 0.0% | 6 | 1.000 | 3.167 | 7.000 |
| idle | 00:00:00.000 | 0.0% | 0 | 0.000 | 0.000 | 0.000 |
| newnews | 00:00:00.000 | 0.0% | 0 | 0.000 | 0.000 | 0.000 |
| nntpwrite | 00:29:07.843 | 2.1% | 13250974 | 0.000 | 0.132 | 170.794 |
| readart | 00:00:00.221 | 0.0% | 6 | 30.250 | 36.833 | 56.000 |
| TOTAL: 23:31:55.185 | 00:29:08.083 | 2.1% | - | - | - | - |
Control commands to INND:
| Command | Number |
|---|---|
| flush | 5 |
| flushlogs | 2 |
| go | 1 |
| logmode | 2 |
| mode | 149 |
| name | 2 |
| pause | 1 |
| paused | 1 |
| reload | 2 |
| renumber | 1 |
| TOTAL: 10 | 166 |
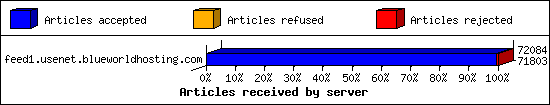
Incoming Feeds (INN):
| Server | Connects | Offered | Taken | Refused | Reject | %Accpt | Elapsed | |
|---|---|---|---|---|---|---|---|---|
| 1 | feed1.usenet.blueworldhosting.com | 13 | 72084 | 71803 | 0 | 281 | 99% | 24:56:10 |
| TOTAL: 1 | 13 | 72084 | 71803 | 0 | 281 | 99% | 24:56:10 | |
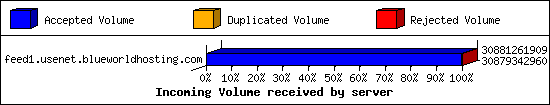
Incoming Volume (INN):
| Server | AcceptVol | DupVol | RejVol | TotalVol | %Acc | Vol/Art | |
|---|---|---|---|---|---|---|---|
| 1 | feed1.usenet.blueworldhosting.com | 28.8 GB | 0.0 KB | 1.8 MB | 28.8 GB | 99% | 418.4 KB |
| TOTAL: 1 | 28.8 GB | 0.0 KB | 1.8 MB | 28.8 GB | 99% | 418.4 KB | |
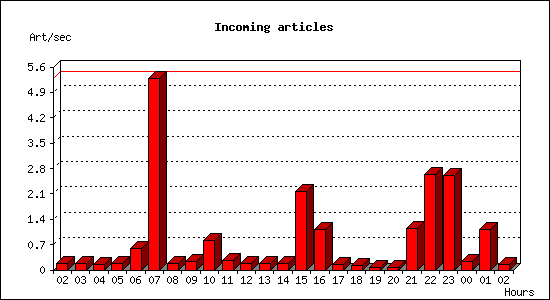
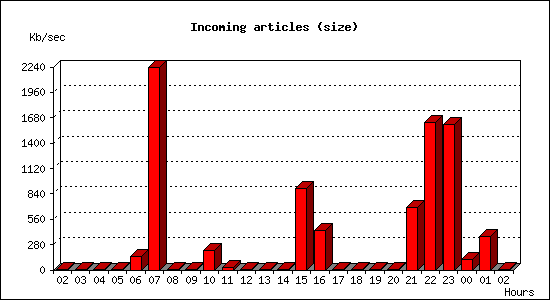
Incoming articles:
| Date | Articles | %Arts | Art/sec | Size | %Size | KB/sec |
|---|---|---|---|---|---|---|
| Oct 7 02:30:00 - 02:59:59 | 316 | 0.4% | 0.18 | 941.1 KB | 0.0% | 0.52 |
| Oct 7 03:00:00 - 03:59:59 | 640 | 0.9% | 0.18 | 2.3 MB | 0.0% | 0.64 |
| Oct 7 04:00:00 - 04:59:59 | 576 | 0.8% | 0.16 | 2.1 MB | 0.0% | 0.60 |
| Oct 7 05:00:00 - 05:59:59 | 600 | 0.8% | 0.17 | 4.9 MB | 0.0% | 1.39 |
| Oct 7 06:00:00 - 06:59:59 | 2103 | 2.9% | 0.58 | 516.4 MB | 1.8% | 146.88 |
| Oct 7 07:00:00 - 07:59:59 | 18972 | 26.4% | 5.27 | 7.7 GB | 26.6% | 2229.09 |
| Oct 7 08:00:00 - 08:59:59 | 610 | 0.8% | 0.17 | 3.4 MB | 0.0% | 0.96 |
| Oct 7 09:00:00 - 09:59:59 | 843 | 1.2% | 0.23 | 9.6 MB | 0.0% | 2.73 |
| Oct 7 10:00:00 - 10:59:59 | 2969 | 4.1% | 0.82 | 759.7 MB | 2.6% | 216.08 |
| Oct 7 11:00:00 - 11:59:59 | 942 | 1.3% | 0.26 | 89.2 MB | 0.3% | 25.37 |
| Oct 7 12:00:00 - 12:59:59 | 626 | 0.9% | 0.17 | 2.7 MB | 0.0% | 0.76 |
| Oct 7 13:00:00 - 13:59:59 | 609 | 0.8% | 0.17 | 2.5 MB | 0.0% | 0.71 |
| Oct 7 14:00:00 - 14:59:59 | 626 | 0.9% | 0.17 | 2.4 MB | 0.0% | 0.69 |
| Oct 7 15:00:00 - 15:59:59 | 7821 | 10.9% | 2.17 | 3.1 GB | 10.8% | 901.13 |
| Oct 7 16:00:00 - 16:59:59 | 4001 | 5.6% | 1.11 | 1.5 GB | 5.2% | 439.41 |
| Oct 7 17:00:00 - 17:59:59 | 537 | 0.7% | 0.15 | 1.6 MB | 0.0% | 0.47 |
| Oct 7 18:00:00 - 18:59:59 | 407 | 0.6% | 0.11 | 33.5 MB | 0.1% | 9.53 |
| Oct 7 19:00:00 - 19:59:59 | 250 | 0.3% | 0.07 | 1.6 MB | 0.0% | 0.45 |
| Oct 7 20:00:00 - 20:59:59 | 245 | 0.3% | 0.07 | 971.8 KB | 0.0% | 0.27 |
| Oct 7 21:00:00 - 21:59:59 | 4124 | 5.7% | 1.15 | 2.3 GB | 8.2% | 684.45 |
| Oct 7 22:00:00 - 22:59:59 | 9460 | 13.2% | 2.63 | 5.6 GB | 19.4% | 1622.68 |
| Oct 7 23:00:00 - 23:59:59 | 9340 | 13.0% | 2.59 | 5.5 GB | 19.2% | 1607.76 |
| Oct 8 00:00:00 - 00:59:59 | 890 | 1.2% | 0.25 | 400.4 MB | 1.4% | 113.90 |
| Oct 8 01:00:00 - 01:59:59 | 4056 | 5.6% | 1.13 | 1.3 GB | 4.4% | 370.28 |
| Oct 8 02:00:00 - 02:30:00 | 265 | 0.4% | 0.15 | 831.9 KB | 0.0% | 0.46 |
| TOTAL: 24:00:00 | 71828 | 100.0% | 0.83 | 28.8 GB | 100.0% | 349.03 |
Sites sending bad articles:
| Server | Total | Group | Dist | Duplic | Unapp | TooOld | Site | Line | Other | |
|---|---|---|---|---|---|---|---|---|---|---|
| 1 | feed1.usenet.blueworldhosting.com | 571 | 235 | 0 | 0 | 0 | 0 | 0 | 0 | 336 |
| TOTAL: 1 | 571 | 235 | 0 | 0 | 0 | 0 | 0 | 0 | 336 | |
Unwanted newsgroups [Top 20]:
| Newsgroup | Count |
|---|---|
| alt.binaries.pictures.erotica.vintage | 30 |
| finet.binaries.keskustelu | 24 |
| al.binaries.test | 17 |
| talk.generic.ua.ws | 12 |
| alt.binaries.pictures.scenic | 12 |
| alt.binaries.pictures.nude.celebrities.fake | 11 |
| alt.binaries.nospam.female.bodyhair | 9 |
| alt.meditation.quanyin | 8 |
| alt.binaries.sounds.anime | 8 |
| alt.binaries.sacd.iso | 7 |
| alt.binaries.nospam.female.bodyhair.pubes | 7 |
| alt.binaries.xxx | 6 |
| alt.binaries.movies.erotica | 5 |
| alt.binaries.sounds.karaoke | 5 |
| alt.binaries.test.yenc | 4 |
| wolfsburg.test | 4 |
| alt.binaries.sounds.lossless | 4 |
| alt.binaries.sounds.mp3.1960s | 3 |
| alt.binaries.boneless | 3 |
| alt.binaries.pictures.wallpaper | 3 |
| TOTAL: 67 | 235 |
INND Python filter [Top 20]:
| Reason | Count |
|---|---|
| Bad Subject (Solution Manual ) | 11 |
| Bad Subject (Solution manual ) | 9 |
| EMP Body Reject | 8 |
| Bad From (PHARMA GRADE) | 6 |
| Bad From (dr.jamesmoore202@gmail.com) | 3 |
| Bad Subject (Buy adderall) | 3 |
| Bad Subject (Buy Xanax) | 2 |
| Bad Subject (Buy Ketamine) | 1 |
| Bad From (FBInCIAnNSATerroristSlayer@yahoo.com) | 1 |
| AUK Bad Crosspost | 1 |
| Bad Subject (Buy ketamine) | 1 |
| Bad Subject (Buy Adderall) | 1 |
| TOTAL: 12 | 47 |
Miscellaneous innd statistics [Top 10]:
| Event | Server | Number |
|---|---|---|
| Including strange strings | ||
| feed1.usenet.blueworldhosting.com | 289 | |
| TOTAL: 1 | 289 | |
| TOTAL: 1 | 289 | |
Outgoing Feeds (innfeed) by Articles:
| Server | Offered | Taken | Refused | Reject | Miss | Spool | %Took | Elapsed | |
|---|---|---|---|---|---|---|---|---|---|
| 1 | feed1.usenet.blueworldhosting.com | 0 | 0 | 0 | 0 | 0 | 0 | 0% | 00:10:00 |
| TOTAL: 1 | 0 | 0 | 0 | 0 | 0 | 0 | 0% | 00:10:00 | |
Outgoing Feeds (innfeed) by Volume:
| Server | AcceptVol | RejectVol | TotalVol | Volume/sec | Vol/Art | Elapsed | |
|---|---|---|---|---|---|---|---|
| 1 | feed1.usenet.blueworldhosting.com | 0.0 KB | 0.0 KB | 0.0 KB | 0.0 KB/s | 0 | 00:10:00 |
| TOTAL: 1 | 0.0 KB | 0.0 KB | 0.0 KB | 0.0 KB/s | 0 | 00:10:00 | |
NNRP readership statistics:
| System | Conn | Arts | Size | Groups | Post | Rej | Elapsed | |
|---|---|---|---|---|---|---|---|---|
| 1 | 023-084-030-207.res.spectrum.com | 62 | 6 | 18.0 KB | 1 | 0 | 0 | 00:40:32 |
| TOTAL: 1 | 62 | 6 | 18.0 KB | 1 | 0 | 0 | 23:31:50 | |
NNRP readership statistics (by domain):
| System | Conn | Arts | Size | Groups | Post | Rej | Elapsed | |
|---|---|---|---|---|---|---|---|---|
| 1 | *.res.spectrum.com | 62 | 6 | 18.0 KB | 1 | 0 | 0 | 00:40:32 |
| 2 | *.stehlik.co.uk | 879 | 0 | 0.0 KB | 0 | 0 | 0 | 22:51:17 |
| TOTAL: 2 | 941 | 6 | 18.0 KB | 1 | 0 | 0 | 23:31:50 | |
NNRP auth users [Top 20]:
| User | Conn |
|---|---|
| jesse | 62 |
| TOTAL: 1 | 62 |
NNRP total resource statistics [Top 20]:
| System | User(ms) | System(ms) | Idle(ms) | Elapsed |
|---|---|---|---|---|
| toma-03.stehlik.co.uk | 177.714 | 59.490 | 0.000 | 22:51:17 |
| 023-084-030-207.res.spectrum.com | 5.365 | 1.078 | 0.296 | 00:40:32 |
| TOTAL: 2 | 183.079 | 60.568 | 0.296 | 23:31:50 |
Curious NNRP server explorers [Top 20]:
| System | Conn |
|---|---|
| toma-03.stehlik.co.uk | 879 |
| TOTAL: 1 | 879 |
NNRP client timeouts [Top 20]:
| System | Conn | Peer |
|---|---|---|
| 023-084-030-207.res.spectrum.com | 62 | 62 |
| toma-03.stehlik.co.uk | 2 | 2 |
| TOTAL: 2 | 64 | 64 |
Newsgroup request counts (by hierarchy):
| Hierarchy | Count | Pct | |
|---|---|---|---|
| 1 | alt | 1 | 100.0% |
| TOTAL: 1 | 1 | 100.0% | |
Newsgroup request counts (by newsgroup) [Top 100]:
| Newsgroup | Count | |
|---|---|---|
| 1 | alt.binaries.multimedia.documentaries | 1 |
| TOTAL: 1 | 1 | |