Log entries by program:
| Program name | Lines | %Lines | Size | %Size |
|---|---|---|---|---|
| nnrpd | 66620 | 52.2% | 5.9 MB | 46.8% |
| inn | 59718 | 46.8% | 6.5 MB | 51.7% |
| innd | 1238 | 1.0% | 176.9 KB | 1.4% |
| innfeed | 158 | 0.1% | 14.3 KB | 0.1% |
| controlchan | 1 | 0.0% | 0.1 KB | 0.0% |
| TOTAL: 5 | 127735 | 100.0% | 12.6 MB | 100.0% |
History cache:
| Reason | Count | %Count |
|---|---|---|
| Do not exist | 58188 | 99.2% |
| Negative hits | 462 | 0.8% |
| Positive hits | 10 | 0.0% |
| Cache misses | 1 | 0.0% |
| TOTAL: 4 | 58661 | 100.0% |
INND timer:
| Code region | Time | Pct | Invoked | Min(ms) | Avg(ms) | Max(ms) |
|---|---|---|---|---|---|---|
| article cancel | 00:00:00.355 | 0.0% | 52 | 0.000 | 6.827 | 26.571 |
| article cleanup | 00:00:00.589 | 0.0% | 58269 | 0.000 | 0.010 | 0.045 |
| article logging | 00:00:00.933 | 0.0% | 58527 | 0.000 | 0.016 | 0.083 |
| article parse | 00:00:51.132 | 0.1% | 5054485 | 0.000 | 0.010 | 0.057 |
| article write | 00:26:04.367 | 1.8% | 58030 | 3.485 | 26.958 | 44.720 |
| artlog/artcncl | 00:00:00.000 | 0.0% | 11 | 0.000 | 0.000 | 0.000 |
| artlog/artparse | 00:00:00.000 | 0.0% | 0 | 0.000 | 0.000 | 0.000 |
| data move | 00:00:06.224 | 0.0% | 5487397 | 0.000 | 0.001 | 0.015 |
| hisgrep/artcncl | 00:00:00.107 | 0.0% | 63 | 0.000 | 1.698 | 10.000 |
| hishave/artcncl | 00:00:00.000 | 0.0% | 11 | 0.000 | 0.000 | 0.000 |
| history grep | 00:00:00.000 | 0.0% | 0 | 0.000 | 0.000 | 0.000 |
| history lookup | 00:00:14.816 | 0.0% | 58731 | 0.092 | 0.252 | 0.686 |
| history sync | 00:00:02.700 | 0.0% | 325 | 0.000 | 8.308 | 11.000 |
| history write | 00:01:09.504 | 0.1% | 58269 | 0.681 | 1.193 | 1.420 |
| hiswrite/artcncl | 00:00:00.000 | 0.0% | 0 | 0.000 | 0.000 | 0.000 |
| idle | 23:10:01.978 | 96.5% | 5047180 | 0.761 | 16.524 | 11761.118 |
| nntp read | 00:01:50.378 | 0.1% | 5047159 | 0.000 | 0.022 | 0.069 |
| overview write | 00:00:20.016 | 0.0% | 58030 | 0.121 | 0.345 | 7.045 |
| perl filter | 00:00:07.314 | 0.0% | 58252 | 0.000 | 0.126 | 0.198 |
| python filter | 00:19:13.694 | 1.3% | 58269 | 0.679 | 19.799 | 32.860 |
| site send | 00:00:01.772 | 0.0% | 58091 | 0.000 | 0.031 | 0.182 |
| TOTAL: 24:00:39.112 | 24:00:05.879 | 100.0% | - | - | - | - |
INNfeed timer:
| Code region | Time | Pct | Invoked | Min(ms) | Avg(ms) | Max(ms) |
|---|---|---|---|---|---|---|
| article new | 00:00:00.000 | 0.0% | 0 | 0.000 | 0.000 | 0.000 |
| article prepare | 00:00:00.000 | 0.0% | 0 | 0.000 | 0.000 | 0.000 |
| article read | 00:00:00.000 | 0.0% | 0 | 0.000 | 0.000 | 0.000 |
| backlog stats | 00:00:00.004 | 0.0% | 3729 | 0.000 | 0.001 | 0.038 |
| callbacks | 00:00:00.000 | 0.0% | 0 | 0.000 | 0.000 | 0.000 |
| data read | 00:00:00.000 | 0.0% | 3 | 0.000 | 0.000 | 0.000 |
| data write | 00:00:00.000 | 0.0% | 3 | 0.000 | 0.000 | 0.000 |
| idle | 23:55:19.994 | 100.0% | 3729 | 17895.382 | 23094.662 | 24154.600 |
| status file | 00:00:00.000 | 0.0% | 6 | 0.000 | 0.000 | 0.000 |
| TOTAL: 23:55:20.038 | 23:55:19.998 | 100.0% | - | - | - | - |
nnrpd timer:
| Code region | Time | Pct | Invoked | Min(ms) | Avg(ms) | Max(ms) |
|---|---|---|---|---|---|---|
| hisgrep | 00:00:02.108 | 0.0% | 5107 | 0.392 | 0.413 | 7.000 |
| idle | 00:00:00.000 | 0.0% | 0 | 0.000 | 0.000 | 0.000 |
| newnews | 00:00:00.000 | 0.0% | 0 | 0.000 | 0.000 | 0.000 |
| nntpwrite | 00:27:28.219 | 1.6% | 13329138 | 0.000 | 0.124 | 116.190 |
| readart | 00:00:17.805 | 0.0% | 5107 | 0.000 | 3.486 | 52.000 |
| TOTAL: 28:21:48.867 | 00:27:48.132 | 1.6% | - | - | - | - |
Control commands to INND:
| Command | Number |
|---|---|
| flush | 5 |
| flushlogs | 2 |
| go | 1 |
| logmode | 2 |
| mode | 149 |
| name | 2 |
| pause | 1 |
| paused | 1 |
| reload | 2 |
| renumber | 1 |
| TOTAL: 10 | 166 |
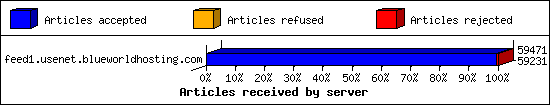
Incoming Feeds (INN):
| Server | Connects | Offered | Taken | Refused | Reject | %Accpt | Elapsed | |
|---|---|---|---|---|---|---|---|---|
| 1 | feed1.usenet.blueworldhosting.com | 28 | 59471 | 59231 | 0 | 240 | 99% | 27:01:13 |
| TOTAL: 1 | 28 | 59471 | 59231 | 0 | 240 | 99% | 27:01:13 | |
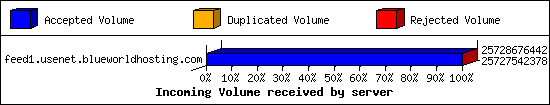
Incoming Volume (INN):
| Server | AcceptVol | DupVol | RejVol | TotalVol | %Acc | Vol/Art | |
|---|---|---|---|---|---|---|---|
| 1 | feed1.usenet.blueworldhosting.com | 24.0 GB | 0.0 KB | 1.1 MB | 24.0 GB | 99% | 422.5 KB |
| TOTAL: 1 | 24.0 GB | 0.0 KB | 1.1 MB | 24.0 GB | 99% | 422.5 KB | |
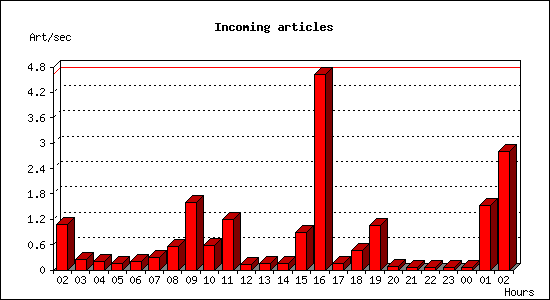
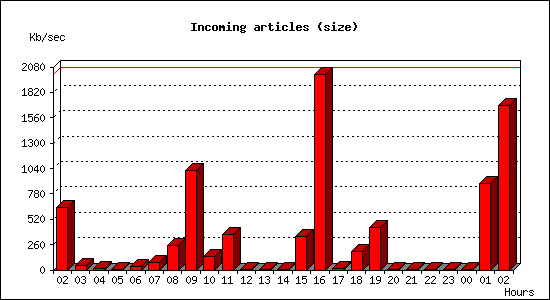
Incoming articles:
| Date | Articles | %Arts | Art/sec | Size | %Size | KB/sec |
|---|---|---|---|---|---|---|
| Oct 8 02:30:00 - 02:59:59 | 1927 | 3.3% | 1.07 | 1.1 GB | 4.6% | 645.03 |
| Oct 8 03:00:00 - 03:59:59 | 863 | 1.5% | 0.24 | 170.3 MB | 0.7% | 48.44 |
| Oct 8 04:00:00 - 04:59:59 | 683 | 1.2% | 0.19 | 70.3 MB | 0.3% | 19.99 |
| Oct 8 05:00:00 - 05:59:59 | 526 | 0.9% | 0.15 | 7.3 MB | 0.0% | 2.08 |
| Oct 8 06:00:00 - 06:59:59 | 715 | 1.2% | 0.20 | 112.1 MB | 0.5% | 31.89 |
| Oct 8 07:00:00 - 07:59:59 | 1095 | 1.8% | 0.30 | 281.0 MB | 1.1% | 79.92 |
| Oct 8 08:00:00 - 08:59:59 | 1980 | 3.3% | 0.55 | 865.0 MB | 3.5% | 246.04 |
| Oct 8 09:00:00 - 09:59:59 | 5744 | 9.7% | 1.60 | 3.5 GB | 14.6% | 1021.01 |
| Oct 8 10:00:00 - 10:59:59 | 2053 | 3.5% | 0.57 | 472.4 MB | 1.9% | 134.38 |
| Oct 8 11:00:00 - 11:59:59 | 4320 | 7.3% | 1.20 | 1.2 GB | 5.1% | 359.28 |
| Oct 8 12:00:00 - 12:59:59 | 499 | 0.8% | 0.14 | 1.5 MB | 0.0% | 0.43 |
| Oct 8 13:00:00 - 13:59:59 | 579 | 1.0% | 0.16 | 3.4 MB | 0.0% | 0.95 |
| Oct 8 14:00:00 - 14:59:59 | 578 | 1.0% | 0.16 | 1.7 MB | 0.0% | 0.48 |
| Oct 8 15:00:00 - 15:59:59 | 3221 | 5.4% | 0.89 | 1.2 GB | 4.9% | 343.55 |
| Oct 8 16:00:00 - 16:59:59 | 16659 | 28.1% | 4.63 | 6.9 GB | 28.7% | 2004.68 |
| Oct 8 17:00:00 - 17:59:59 | 579 | 1.0% | 0.16 | 50.0 MB | 0.2% | 14.22 |
| Oct 8 18:00:00 - 18:59:59 | 1659 | 2.8% | 0.46 | 649.0 MB | 2.6% | 184.60 |
| Oct 8 19:00:00 - 19:59:59 | 3823 | 6.5% | 1.06 | 1.5 GB | 6.3% | 440.49 |
| Oct 8 20:00:00 - 20:59:59 | 261 | 0.4% | 0.07 | 15.0 MB | 0.1% | 4.27 |
| Oct 8 21:00:00 - 21:59:59 | 215 | 0.4% | 0.06 | 647.0 KB | 0.0% | 0.18 |
| Oct 8 22:00:00 - 22:59:59 | 245 | 0.4% | 0.07 | 1009.2 KB | 0.0% | 0.28 |
| Oct 8 23:00:00 - 23:59:59 | 229 | 0.4% | 0.06 | 893.0 KB | 0.0% | 0.25 |
| Oct 9 00:00:00 - 00:59:59 | 250 | 0.4% | 0.07 | 3.0 MB | 0.0% | 0.86 |
| Oct 9 01:00:00 - 01:59:59 | 5464 | 9.2% | 1.52 | 3.0 GB | 12.6% | 881.38 |
| Oct 9 02:00:00 - 02:30:00 | 5043 | 8.5% | 2.80 | 2.9 GB | 12.1% | 1689.44 |
| TOTAL: 24:00:00 | 59210 | 100.0% | 0.69 | 24.0 GB | 100.0% | 291.12 |
Sites sending bad articles:
| Server | Total | Group | Dist | Duplic | Unapp | TooOld | Site | Line | Other | |
|---|---|---|---|---|---|---|---|---|---|---|
| 1 | feed1.usenet.blueworldhosting.com | 497 | 223 | 0 | 0 | 0 | 0 | 0 | 0 | 274 |
| TOTAL: 1 | 497 | 223 | 0 | 0 | 0 | 0 | 0 | 0 | 274 | |
Unwanted newsgroups [Top 20]:
| Newsgroup | Count |
|---|---|
| alt.binaries.pictures.rail | 22 |
| alt.binaries.pictures.wallpaper | 22 |
| finet.binaries.keskustelu | 20 |
| alt.binaries.pictures.nude.celebrities.fake | 20 |
| alt.binaries.test.yenc | 8 |
| alt.binaries.movies.erotica | 8 |
| alt.binaries.pictures.erotica.vintage | 6 |
| alt.binaries.sacd.iso | 6 |
| alt.binaries.pictures.scenic | 6 |
| test.post | 6 |
| alt.binaries.3d.poser | 5 |
| alt.binaries.pictures.teen-starlets | 5 |
| alt.binaries.drwho | 5 |
| alt.binaries.nospam.female.bodyhair.pubes | 4 |
| alt.binaries.boneless | 4 |
| alt.binaries.gdead | 4 |
| al.binaries.test | 4 |
| alt.binaries.pictures.nylons | 3 |
| alt.binaries.nospam.female.bodyhair | 3 |
| alt.binaries.howard-stern | 3 |
| TOTAL: 58 | 223 |
INND Python filter [Top 20]:
| Reason | Count |
|---|---|
| Bad Subject (Solution Manual ) | 5 |
| EMP Body Reject | 5 |
| Bad From (FBInCIAnNSATerroristSlayer@yahoo.com) | 4 |
| Bad Subject (Solution manual ) | 2 |
| Bad Subject (Buy Oxycodon) | 1 |
| TOTAL: 5 | 17 |
Miscellaneous innd statistics [Top 10]:
| Event | Server | Number |
|---|---|---|
| Including strange strings | ||
| feed1.usenet.blueworldhosting.com | 257 | |
| TOTAL: 1 | 257 | |
| TOTAL: 1 | 257 | |
Outgoing Feeds (innfeed) by Articles:
| Server | Offered | Taken | Refused | Reject | Miss | Spool | %Took | Elapsed | |
|---|---|---|---|---|---|---|---|---|---|
| 1 | feed1.usenet.blueworldhosting.com | 0 | 0 | 0 | 0 | 0 | 0 | 0% | 00:10:01 |
| TOTAL: 1 | 0 | 0 | 0 | 0 | 0 | 0 | 0% | 00:10:01 | |
Outgoing Feeds (innfeed) by Volume:
| Server | AcceptVol | RejectVol | TotalVol | Volume/sec | Vol/Art | Elapsed | |
|---|---|---|---|---|---|---|---|
| 1 | feed1.usenet.blueworldhosting.com | 0.0 KB | 0.0 KB | 0.0 KB | 0.0 KB/s | 0 | 00:10:01 |
| TOTAL: 1 | 0.0 KB | 0.0 KB | 0.0 KB | 0.0 KB/s | 0 | 00:10:01 | |
NNRP readership statistics:
| System | Conn | Arts | Size | Groups | Post | Rej | Elapsed | |
|---|---|---|---|---|---|---|---|---|
| 1 | 023-084-030-207.res.spectrum.com | 232 | 3 | 7.0 KB | 1 | 0 | 0 | 02:06:38 |
| 2 | 69.166.204.211 | 24 | 0 | 0.0 KB | 0 | 5104 | 0 | 03:27:24 |
| TOTAL: 2 | 256 | 3 | 7.0 KB | 1 | 5104 | 0 | 28:21:42 | |
NNRP readership statistics (by domain):
| System | Conn | Arts | Size | Groups | Post | Rej | Elapsed | |
|---|---|---|---|---|---|---|---|---|
| 1 | *.res.spectrum.com | 232 | 3 | 7.0 KB | 1 | 0 | 0 | 02:06:38 |
| 2 | unresolved | 24 | 0 | 0.0 KB | 0 | 5104 | 0 | 03:27:24 |
| 3 | *.stehlik.co.uk | 906 | 0 | 0.0 KB | 0 | 0 | 0 | 22:47:39 |
| TOTAL: 3 | 1162 | 3 | 7.0 KB | 1 | 5104 | 0 | 28:21:42 | |
NNRP auth users [Top 20]:
| User | Conn |
|---|---|
| jesse | 256 |
| TOTAL: 1 | 256 |
NNRP total resource statistics [Top 20]:
| System | User(ms) | System(ms) | Idle(ms) | Elapsed |
|---|---|---|---|---|
| toma-03.stehlik.co.uk | 179.835 | 60.765 | 0.000 | 22:47:39 |
| 69.166.204.211 | 122.567 | 108.592 | 0.122 | 03:27:24 |
| 023-084-030-207.res.spectrum.com | 17.987 | 2.687 | 1.141 | 02:06:38 |
| TOTAL: 3 | 320.389 | 172.044 | 1.263 | 28:21:42 |
Curious NNRP server explorers [Top 20]:
| System | Conn |
|---|---|
| toma-03.stehlik.co.uk | 906 |
| TOTAL: 1 | 906 |
NNRP client timeouts [Top 20]:
| System | Conn | Peer |
|---|---|---|
| 023-084-030-207.res.spectrum.com | 232 | 232 |
| toma-03.stehlik.co.uk | 3 | 3 |
| TOTAL: 2 | 235 | 235 |
Newsgroup request counts (by hierarchy):
| Hierarchy | Count | Pct | |
|---|---|---|---|
| 1 | alt | 1 | 100.0% |
| TOTAL: 1 | 1 | 100.0% | |
Newsgroup request counts (by newsgroup) [Top 100]:
| Newsgroup | Count | |
|---|---|---|
| 1 | alt.free.newsservers | 1 |
| TOTAL: 1 | 1 | |