Log entries by program:
| Program name | Lines | %Lines | Size | %Size |
|---|---|---|---|---|
| inn | 60675 | 49.9% | 6.8 MB | 56.1% |
| nnrpd | 59446 | 48.9% | 5.2 MB | 42.4% |
| innd | 1272 | 1.0% | 171.7 KB | 1.4% |
| innfeed | 157 | 0.1% | 14.4 KB | 0.1% |
| nocem | 11 | 0.0% | 1.0 KB | 0.0% |
| controlchan | 1 | 0.0% | 0.0 KB | 0.0% |
| TOTAL: 6 | 121562 | 100.0% | 12.2 MB | 100.0% |
History cache:
| Reason | Count | %Count |
|---|---|---|
| Do not exist | 60311 | 98.8% |
| Negative hits | 742 | 1.2% |
| Positive hits | 14 | 0.0% |
| Cache misses | 1 | 0.0% |
| TOTAL: 4 | 61068 | 100.0% |
INND timer:
| Code region | Time | Pct | Invoked | Min(ms) | Avg(ms) | Max(ms) |
|---|---|---|---|---|---|---|
| article cancel | 00:00:00.293 | 0.0% | 51 | 0.000 | 5.745 | 22.000 |
| article cleanup | 00:00:00.649 | 0.0% | 60349 | 0.000 | 0.011 | 0.067 |
| article logging | 00:00:00.953 | 0.0% | 60680 | 0.000 | 0.016 | 0.111 |
| article parse | 00:00:49.708 | 0.1% | 4589027 | 0.000 | 0.011 | 0.053 |
| article write | 00:01:14.650 | 0.1% | 59988 | 0.288 | 1.244 | 12.500 |
| artlog/artcncl | 00:00:00.000 | 0.0% | 15 | 0.000 | 0.000 | 0.000 |
| data move | 00:00:04.877 | 0.0% | 5020011 | 0.000 | 0.001 | 0.017 |
| hisgrep/artcncl | 00:00:00.043 | 0.0% | 62 | 0.000 | 0.694 | 7.000 |
| hishave/artcncl | 00:00:00.000 | 0.0% | 15 | 0.000 | 0.000 | 0.000 |
| history grep | 00:00:00.000 | 0.0% | 0 | 0.000 | 0.000 | 0.000 |
| history lookup | 00:00:06.891 | 0.0% | 61111 | 0.020 | 0.113 | 0.444 |
| history sync | 00:00:05.254 | 0.0% | 332 | 0.000 | 15.825 | 20.000 |
| history write | 00:01:56.444 | 0.1% | 60349 | 0.111 | 1.930 | 2.135 |
| idle | 23:31:55.580 | 98.0% | 4580116 | 0.865 | 18.496 | 28579.143 |
| nntp read | 00:03:09.437 | 0.2% | 4579901 | 0.000 | 0.041 | 0.128 |
| overview write | 00:00:09.505 | 0.0% | 59988 | 0.101 | 0.158 | 1.919 |
| perl filter | 00:00:06.647 | 0.0% | 60267 | 0.000 | 0.110 | 0.182 |
| python filter | 00:20:35.604 | 1.4% | 60349 | 0.593 | 20.474 | 32.969 |
| site send | 00:00:01.813 | 0.0% | 60055 | 0.000 | 0.030 | 0.222 |
| TOTAL: 24:00:41.400 | 24:00:18.348 | 100.0% | - | - | - | - |
INNfeed timer:
| Code region | Time | Pct | Invoked | Min(ms) | Avg(ms) | Max(ms) |
|---|---|---|---|---|---|---|
| article new | 00:00:00.000 | 0.0% | 0 | 0.000 | 0.000 | 0.000 |
| article prepare | 00:00:00.000 | 0.0% | 0 | 0.000 | 0.000 | 0.000 |
| article read | 00:00:00.000 | 0.0% | 0 | 0.000 | 0.000 | 0.000 |
| backlog stats | 00:00:00.003 | 0.0% | 3727 | 0.000 | 0.001 | 0.038 |
| callbacks | 00:00:00.000 | 0.0% | 0 | 0.000 | 0.000 | 0.000 |
| data read | 00:00:00.000 | 0.0% | 3 | 0.000 | 0.000 | 0.000 |
| data write | 00:00:00.000 | 0.0% | 3 | 0.000 | 0.000 | 0.000 |
| idle | 23:55:42.640 | 100.0% | 3727 | 17651.176 | 23113.131 | 24135.800 |
| status file | 00:00:00.001 | 0.0% | 6 | 0.000 | 0.167 | 0.500 |
| TOTAL: 23:55:42.688 | 23:55:42.644 | 100.0% | - | - | - | - |
nnrpd timer:
| Code region | Time | Pct | Invoked | Min(ms) | Avg(ms) | Max(ms) |
|---|---|---|---|---|---|---|
| hisgrep | 00:00:00.010 | 0.0% | 115 | 0.000 | 0.087 | 0.667 |
| idle | 00:00:00.000 | 0.0% | 0 | 0.000 | 0.000 | 0.000 |
| newnews | 00:00:00.000 | 0.0% | 0 | 0.000 | 0.000 | 0.000 |
| nntpwrite | 00:37:40.890 | 2.6% | 13115154 | 0.000 | 0.172 | 1324.667 |
| readart | 00:00:00.032 | 0.0% | 138 | 0.000 | 0.232 | 0.343 |
| TOTAL: 24:11:46.638 | 00:37:40.932 | 2.6% | - | - | - | - |
Control commands to INND:
| Command | Number |
|---|---|
| flush | 5 |
| flushlogs | 2 |
| go | 1 |
| logmode | 2 |
| mode | 149 |
| name | 2 |
| pause | 1 |
| paused | 1 |
| reload | 2 |
| renumber | 1 |
| TOTAL: 10 | 166 |
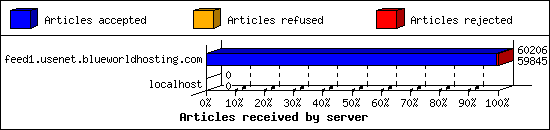
Incoming Feeds (INN):
| Server | Connects | Offered | Taken | Refused | Reject | %Accpt | Elapsed | |
|---|---|---|---|---|---|---|---|---|
| 1 | feed1.usenet.blueworldhosting.com | 9 | 60206 | 59845 | 0 | 361 | 99% | 24:13:41 |
| 2 | localhost | 3 | 0 | 0 | 0 | 0 | 0% | 00:00:00 |
| TOTAL: 2 | 12 | 60206 | 59845 | 0 | 361 | 99% | 24:13:41 | |
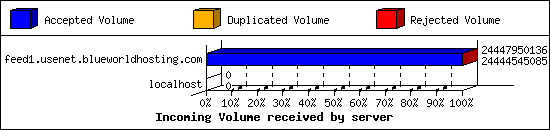
Incoming Volume (INN):
| Server | AcceptVol | DupVol | RejVol | TotalVol | %Acc | Vol/Art | |
|---|---|---|---|---|---|---|---|
| 1 | feed1.usenet.blueworldhosting.com | 22.8 GB | 0.0 KB | 3.2 MB | 22.8 GB | 99% | 396.6 KB |
| 2 | localhost | 0.0 KB | 0.0 KB | 0.0 KB | 0.0 KB | 0% | 0 |
| TOTAL: 2 | 22.8 GB | 0.0 KB | 3.2 MB | 22.8 GB | 99% | 396.6 KB | |
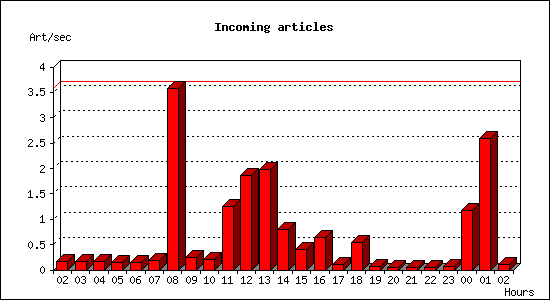
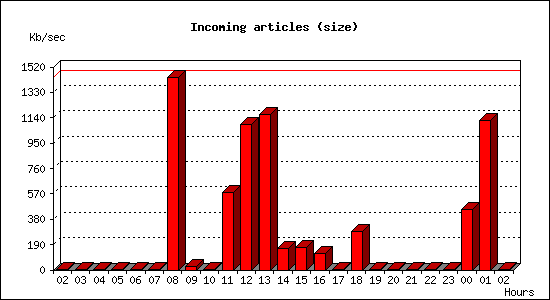
Incoming articles:
| Date | Articles | %Arts | Art/sec | Size | %Size | KB/sec |
|---|---|---|---|---|---|---|
| Nov 9 02:30:00 - 02:59:59 | 299 | 0.5% | 0.17 | 740.9 KB | 0.0% | 0.41 |
| Nov 9 03:00:00 - 03:59:59 | 623 | 1.0% | 0.17 | 1.7 MB | 0.0% | 0.48 |
| Nov 9 04:00:00 - 04:59:59 | 619 | 1.0% | 0.17 | 1.9 MB | 0.0% | 0.53 |
| Nov 9 05:00:00 - 05:59:59 | 553 | 0.9% | 0.15 | 1.6 MB | 0.0% | 0.45 |
| Nov 9 06:00:00 - 06:59:59 | 541 | 0.9% | 0.15 | 1.4 MB | 0.0% | 0.40 |
| Nov 9 07:00:00 - 07:59:59 | 690 | 1.2% | 0.19 | 22.7 MB | 0.1% | 6.46 |
| Nov 9 08:00:00 - 08:59:59 | 12853 | 21.4% | 3.57 | 5.0 GB | 21.8% | 1444.16 |
| Nov 9 09:00:00 - 09:59:59 | 903 | 1.5% | 0.25 | 80.1 MB | 0.3% | 22.79 |
| Nov 9 10:00:00 - 10:59:59 | 727 | 1.2% | 0.20 | 2.0 MB | 0.0% | 0.56 |
| Nov 9 11:00:00 - 11:59:59 | 4525 | 7.5% | 1.26 | 2.0 GB | 8.8% | 580.44 |
| Nov 9 12:00:00 - 12:59:59 | 6737 | 11.2% | 1.87 | 3.8 GB | 16.5% | 1092.58 |
| Nov 9 13:00:00 - 13:59:59 | 7137 | 11.9% | 1.98 | 4.0 GB | 17.5% | 1161.19 |
| Nov 9 14:00:00 - 14:59:59 | 2908 | 4.8% | 0.81 | 568.2 MB | 2.4% | 161.62 |
| Nov 9 15:00:00 - 15:59:59 | 1431 | 2.4% | 0.40 | 603.6 MB | 2.6% | 171.70 |
| Nov 9 16:00:00 - 16:59:59 | 2273 | 3.8% | 0.63 | 440.7 MB | 1.9% | 125.35 |
| Nov 9 17:00:00 - 17:59:59 | 372 | 0.6% | 0.10 | 1.5 MB | 0.0% | 0.43 |
| Nov 9 18:00:00 - 18:59:59 | 1918 | 3.2% | 0.53 | 1016.2 MB | 4.4% | 289.06 |
| Nov 9 19:00:00 - 19:59:59 | 270 | 0.5% | 0.07 | 4.9 MB | 0.0% | 1.39 |
| Nov 9 20:00:00 - 20:59:59 | 188 | 0.3% | 0.05 | 692.5 KB | 0.0% | 0.19 |
| Nov 9 21:00:00 - 21:59:59 | 197 | 0.3% | 0.05 | 764.3 KB | 0.0% | 0.21 |
| Nov 9 22:00:00 - 22:59:59 | 203 | 0.3% | 0.06 | 610.5 KB | 0.0% | 0.17 |
| Nov 9 23:00:00 - 23:59:59 | 257 | 0.4% | 0.07 | 944.2 KB | 0.0% | 0.26 |
| Nov 10 00:00:00 - 00:59:59 | 4214 | 7.0% | 1.17 | 1.6 GB | 6.8% | 452.14 |
| Nov 10 01:00:00 - 01:59:59 | 9340 | 15.6% | 2.59 | 3.8 GB | 16.9% | 1118.23 |
| Nov 10 02:00:00 - 02:30:00 | 191 | 0.3% | 0.11 | 4.8 MB | 0.0% | 2.71 |
| TOTAL: 24:00:00 | 59969 | 100.0% | 0.69 | 22.8 GB | 100.0% | 276.35 |
Sites sending bad articles:
| Server | Total | Group | Dist | Duplic | Unapp | TooOld | Site | Line | Other | |
|---|---|---|---|---|---|---|---|---|---|---|
| 1 | feed1.usenet.blueworldhosting.com | 691 | 276 | 0 | 0 | 4 | 0 | 0 | 0 | 411 |
| TOTAL: 1 | 691 | 276 | 0 | 0 | 4 | 0 | 0 | 0 | 411 | |
Unwanted newsgroups [Top 20]:
| Newsgroup | Count |
|---|---|
| finet.binaries.keskustelu | 66 |
| alt.binaries.pictures.purebeauty | 21 |
| alt.binaries.pictures.earlmiller | 17 |
| alt.binaries.nospam.female.bodyhair | 16 |
| alt.binaries.pictures.wallpaper | 12 |
| alt.binaries.pictures.nude.celebrities.fake | 12 |
| alt.culture.underwear | 10 |
| alt.binaries.nospam.female.bodyhair.pubes | 9 |
| alt.binaries.test.yenc | 9 |
| de.org.politik.misc | 8 |
| alt.binaries.pictures.scenic | 8 |
| alt.binaries.drwho | 6 |
| alt.binaries.sounds.radio.coasttocoast.am | 5 |
| ee.arvutid | 5 |
| alt.binaries.pictures.nude | 5 |
| alt.binaries.pictures.rail | 4 |
| alt.binaries.pictures.aviation | 3 |
| alt.culture | 3 |
| alt.binaries.automobile.pictures | 3 |
| alt.binaries.sounds.lossless | 3 |
| TOTAL: 60 | 276 |
Supposedly-moderated groups with unmoderated postings [Top 20]:
| Groups | Count |
|---|---|
| comp.compilers | 1 |
| sci.aeronautics | 1 |
| soc.answers | 1 |
| bit.listserv.catholic | 1 |
| TOTAL: 4 | 4 |
INND Python filter [Top 20]:
| Reason | Count |
|---|---|
| EMP Body Reject | 58 |
| Bad Subject (Solution manual ) | 11 |
| Bad From (FBInCIAnNSATerroristSlayer@yahoo.com) | 7 |
| Bad Subject (Solution Manual ) | 5 |
| Bad Subject (Buy Xanax) | 1 |
| TOTAL: 5 | 82 |
NoCeM on Spool:
| Id | Good | Bad | Unique | Total |
|---|---|---|---|---|
| bleachbot@httrack.com | 4 | 0 | 4 | 4 |
| TOTAL: 1 | 4 | 0 | 4 | 4 |
Miscellaneous innd statistics [Top 10]:
| Event | Server | Number |
|---|---|---|
| Including strange strings | ||
| feed1.usenet.blueworldhosting.com | 329 | |
| TOTAL: 1 | 329 | |
| TOTAL: 1 | 329 | |
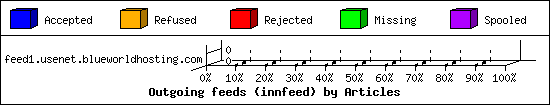
Outgoing Feeds (innfeed) by Articles:
| Server | Offered | Taken | Refused | Reject | Miss | Spool | %Took | Elapsed | |
|---|---|---|---|---|---|---|---|---|---|
| 1 | feed1.usenet.blueworldhosting.com | 0 | 0 | 0 | 0 | 0 | 0 | 0% | 00:10:00 |
| TOTAL: 1 | 0 | 0 | 0 | 0 | 0 | 0 | 0% | 00:10:00 | |
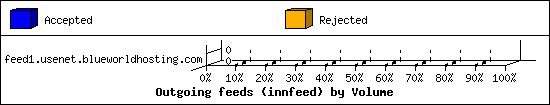
Outgoing Feeds (innfeed) by Volume:
| Server | AcceptVol | RejectVol | TotalVol | Volume/sec | Vol/Art | Elapsed | |
|---|---|---|---|---|---|---|---|
| 1 | feed1.usenet.blueworldhosting.com | 0.0 KB | 0.0 KB | 0.0 KB | 0.0 KB/s | 0 | 00:10:00 |
| TOTAL: 1 | 0.0 KB | 0.0 KB | 0.0 KB | 0.0 KB/s | 0 | 00:10:00 | |
NNRP readership statistics:
| System | Conn | Arts | Size | Groups | Post | Rej | Elapsed | |
|---|---|---|---|---|---|---|---|---|
| 1 | 023-084-030-207.res.spectrum.com | 148 | 138 | 84.4 MB | 6 | 1 | 0 | 01:32:39 |
| TOTAL: 1 | 148 | 138 | 84.4 MB | 6 | 1 | 0 | 24:11:41 | |
NNRP readership statistics (by domain):
| System | Conn | Arts | Size | Groups | Post | Rej | Elapsed | |
|---|---|---|---|---|---|---|---|---|
| 1 | *.res.spectrum.com | 148 | 138 | 84.4 MB | 6 | 1 | 0 | 01:32:39 |
| 2 | *.stehlik.co.uk | 857 | 0 | 0.0 KB | 0 | 0 | 0 | 22:39:01 |
| TOTAL: 2 | 1005 | 138 | 84.4 MB | 6 | 1 | 0 | 24:11:41 | |
NNRP auth users [Top 20]:
| User | Conn |
|---|---|
| jesse | 147 |
| TOTAL: 1 | 147 |
NNRP total resource statistics [Top 20]:
| System | User(ms) | System(ms) | Idle(ms) | Elapsed |
|---|---|---|---|---|
| toma-03.stehlik.co.uk | 174.616 | 60.677 | 0.000 | 22:39:01 |
| 023-084-030-207.res.spectrum.com | 12.305 | 2.891 | 0.895 | 01:32:39 |
| TOTAL: 2 | 186.921 | 63.568 | 0.895 | 24:11:41 |
Curious NNRP server explorers [Top 20]:
| System | Conn |
|---|---|
| toma-03.stehlik.co.uk | 857 |
| TOTAL: 1 | 857 |
NNRP client timeouts [Top 20]:
| System | Conn | Peer |
|---|---|---|
| 023-084-030-207.res.spectrum.com | 148 | 148 |
| TOTAL: 1 | 148 | 148 |
Newsgroup request counts (by hierarchy):
| Hierarchy | Count | Pct | |
|---|---|---|---|
| 1 | alt | 120 | 100.0% |
| TOTAL: 1 | 120 | 100.0% | |
Newsgroup request counts (by newsgroup) [Top 100]:
| Newsgroup | Count | |
|---|---|---|
| 1 | alt.test | 103 |
| 2 | alt.binaries.multimedia.documentaries | 16 |
| 3 | alt.binaries.documentaries | 1 |
| TOTAL: 3 | 120 | |