Log entries by program:
| Program name | Lines | %Lines | Size | %Size |
|---|---|---|---|---|
| nnrpd | 60909 | 62.1% | 5.3 MB | 56.1% |
| inn | 35968 | 36.6% | 3.9 MB | 42.1% |
| innd | 1122 | 1.1% | 157.4 KB | 1.6% |
| innfeed | 159 | 0.2% | 14.3 KB | 0.1% |
| controlchan | 1 | 0.0% | 0.1 KB | 0.0% |
| nocem | 1 | 0.0% | 0.1 KB | 0.0% |
| TOTAL: 6 | 98160 | 100.0% | 9.4 MB | 100.0% |
History cache:
| Reason | Count | %Count |
|---|---|---|
| Do not exist | 35555 | 98.0% |
| Negative hits | 736 | 2.0% |
| Positive hits | 4 | 0.0% |
| Cache misses | 3 | 0.0% |
| TOTAL: 4 | 36298 | 100.0% |
INND timer:
| Code region | Time | Pct | Invoked | Min(ms) | Avg(ms) | Max(ms) |
|---|---|---|---|---|---|---|
| article cancel | 00:00:00.288 | 0.0% | 60 | 0.000 | 4.800 | 36.000 |
| article cleanup | 00:00:00.348 | 0.0% | 35556 | 0.000 | 0.010 | 0.178 |
| article logging | 00:00:00.550 | 0.0% | 35872 | 0.000 | 0.015 | 0.070 |
| article parse | 00:00:21.386 | 0.0% | 1864806 | 0.000 | 0.011 | 0.130 |
| article write | 00:05:46.062 | 0.4% | 35276 | 3.021 | 9.810 | 28.419 |
| artlog/artcncl | 00:00:00.000 | 0.0% | 7 | 0.000 | 0.000 | 0.000 |
| data move | 00:00:02.301 | 0.0% | 2058584 | 0.000 | 0.001 | 0.019 |
| hisgrep/artcncl | 00:00:00.015 | 0.0% | 67 | 0.000 | 0.224 | 6.000 |
| hishave/artcncl | 00:00:00.000 | 0.0% | 7 | 0.000 | 0.000 | 0.000 |
| history grep | 00:00:00.000 | 0.0% | 0 | 0.000 | 0.000 | 0.000 |
| history lookup | 00:00:01.702 | 0.0% | 36292 | 0.000 | 0.047 | 0.150 |
| history sync | 00:00:08.024 | 0.0% | 338 | 0.000 | 23.740 | 29.500 |
| history write | 00:01:38.276 | 0.1% | 35556 | 0.053 | 2.764 | 3.321 |
| idle | 23:31:59.003 | 98.7% | 1860081 | 1.000 | 45.546 | 17147.771 |
| nntp read | 00:01:23.330 | 0.1% | 1859850 | 0.000 | 0.045 | 0.093 |
| overview write | 00:00:09.613 | 0.0% | 35276 | 0.115 | 0.273 | 2.506 |
| perl filter | 00:00:03.275 | 0.0% | 35497 | 0.000 | 0.092 | 0.161 |
| python filter | 00:08:56.513 | 0.6% | 35556 | 0.674 | 15.089 | 25.920 |
| site send | 00:00:00.997 | 0.0% | 35350 | 0.000 | 0.028 | 0.094 |
| TOTAL: 23:50:44.407 | 23:50:31.683 | 100.0% | - | - | - | - |
INNfeed timer:
| Code region | Time | Pct | Invoked | Min(ms) | Avg(ms) | Max(ms) |
|---|---|---|---|---|---|---|
| article new | 00:00:00.000 | 0.0% | 0 | 0.000 | 0.000 | 0.000 |
| article prepare | 00:00:00.000 | 0.0% | 0 | 0.000 | 0.000 | 0.000 |
| article read | 00:00:00.000 | 0.0% | 0 | 0.000 | 0.000 | 0.000 |
| backlog stats | 00:00:00.004 | 0.0% | 3731 | 0.000 | 0.001 | 0.038 |
| callbacks | 00:00:00.000 | 0.0% | 0 | 0.000 | 0.000 | 0.000 |
| data read | 00:00:00.000 | 0.0% | 3 | 0.000 | 0.000 | 0.000 |
| data write | 00:00:00.000 | 0.0% | 3 | 0.000 | 0.000 | 0.000 |
| idle | 23:56:29.498 | 100.0% | 3731 | 17571.800 | 23100.911 | 25090.708 |
| status file | 00:00:00.003 | 0.0% | 6 | 0.250 | 0.500 | 1.000 |
| TOTAL: 23:56:29.537 | 23:56:29.505 | 100.0% | - | - | - | - |
nnrpd timer:
| Code region | Time | Pct | Invoked | Min(ms) | Avg(ms) | Max(ms) |
|---|---|---|---|---|---|---|
| hisgrep | 00:00:00.002 | 0.0% | 41 | 0.000 | 0.049 | 0.250 |
| idle | 00:00:00.000 | 0.0% | 0 | 0.000 | 0.000 | 0.000 |
| newnews | 00:00:00.000 | 0.0% | 0 | 0.000 | 0.000 | 0.000 |
| nntpwrite | 00:28:40.241 | 2.1% | 13384580 | 0.000 | 0.129 | 454.182 |
| readart | 00:00:00.006 | 0.0% | 54 | 0.000 | 0.111 | 0.300 |
| TOTAL: 22:51:19.234 | 00:28:40.249 | 2.1% | - | - | - | - |
Control commands to INND:
| Command | Number |
|---|---|
| flush | 5 |
| flushlogs | 2 |
| go | 1 |
| logmode | 2 |
| mode | 148 |
| name | 2 |
| pause | 1 |
| paused | 1 |
| reload | 2 |
| renumber | 1 |
| TOTAL: 10 | 165 |
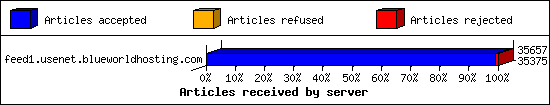
Incoming Feeds (INN):
| Server | Connects | Offered | Taken | Refused | Reject | %Accpt | Elapsed | |
|---|---|---|---|---|---|---|---|---|
| 1 | feed1.usenet.blueworldhosting.com | 19 | 35657 | 35375 | 0 | 282 | 99% | 25:55:13 |
| TOTAL: 1 | 19 | 35657 | 35375 | 0 | 282 | 99% | 25:55:13 | |
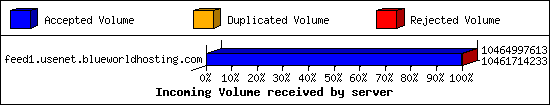
Incoming Volume (INN):
| Server | AcceptVol | DupVol | RejVol | TotalVol | %Acc | Vol/Art | |
|---|---|---|---|---|---|---|---|
| 1 | feed1.usenet.blueworldhosting.com | 9.7 GB | 0.0 KB | 3.1 MB | 9.7 GB | 99% | 286.6 KB |
| TOTAL: 1 | 9.7 GB | 0.0 KB | 3.1 MB | 9.7 GB | 99% | 286.6 KB | |
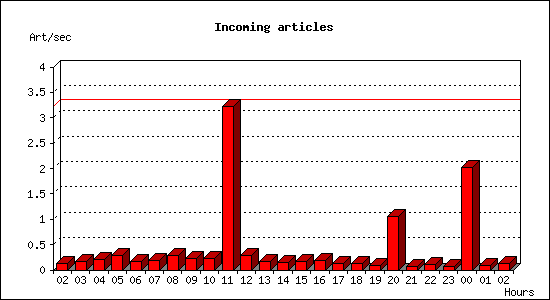
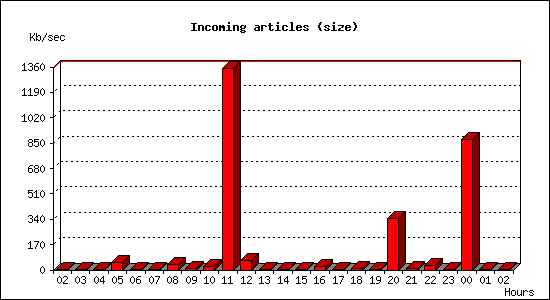
Incoming articles:
| Date | Articles | %Arts | Art/sec | Size | %Size | KB/sec |
|---|---|---|---|---|---|---|
| Nov 16 02:30:00 - 02:59:59 | 245 | 0.7% | 0.14 | 726.3 KB | 0.0% | 0.40 |
| Nov 16 03:00:00 - 03:59:59 | 609 | 1.7% | 0.17 | 15.2 MB | 0.2% | 4.34 |
| Nov 16 04:00:00 - 04:59:59 | 712 | 2.0% | 0.20 | 17.4 MB | 0.2% | 4.95 |
| Nov 16 05:00:00 - 05:59:59 | 1025 | 2.9% | 0.28 | 174.6 MB | 1.7% | 49.65 |
| Nov 16 06:00:00 - 06:59:59 | 638 | 1.8% | 0.18 | 1.8 MB | 0.0% | 0.52 |
| Nov 16 07:00:00 - 07:59:59 | 650 | 1.8% | 0.18 | 2.1 MB | 0.0% | 0.61 |
| Nov 16 08:00:00 - 08:59:59 | 1056 | 3.0% | 0.29 | 128.9 MB | 1.3% | 36.66 |
| Nov 16 09:00:00 - 09:59:59 | 826 | 2.3% | 0.23 | 33.4 MB | 0.3% | 9.51 |
| Nov 16 10:00:00 - 10:59:59 | 791 | 2.2% | 0.22 | 82.1 MB | 0.8% | 23.35 |
| Nov 16 11:00:00 - 11:59:59 | 11614 | 32.8% | 3.23 | 4.6 GB | 47.6% | 1350.28 |
| Nov 16 12:00:00 - 12:59:59 | 1005 | 2.8% | 0.28 | 228.5 MB | 2.3% | 65.01 |
| Nov 16 13:00:00 - 13:59:59 | 603 | 1.7% | 0.17 | 2.5 MB | 0.0% | 0.70 |
| Nov 16 14:00:00 - 14:59:59 | 531 | 1.5% | 0.15 | 2.3 MB | 0.0% | 0.65 |
| Nov 16 15:00:00 - 15:59:59 | 605 | 1.7% | 0.17 | 4.4 MB | 0.0% | 1.25 |
| Nov 16 16:00:00 - 16:59:59 | 699 | 2.0% | 0.19 | 75.4 MB | 0.8% | 21.44 |
| Nov 16 17:00:00 - 17:59:59 | 449 | 1.3% | 0.12 | 1.7 MB | 0.0% | 0.49 |
| Nov 16 18:00:00 - 18:59:59 | 431 | 1.2% | 0.12 | 39.0 MB | 0.4% | 11.08 |
| Nov 16 19:00:00 - 19:59:59 | 291 | 0.8% | 0.08 | 2.1 MB | 0.0% | 0.59 |
| Nov 16 20:00:00 - 20:59:59 | 3806 | 10.8% | 1.06 | 1.2 GB | 12.2% | 346.60 |
| Nov 16 21:00:00 - 21:59:59 | 256 | 0.7% | 0.07 | 24.3 MB | 0.2% | 6.92 |
| Nov 16 22:00:00 - 22:59:59 | 355 | 1.0% | 0.10 | 97.0 MB | 1.0% | 27.60 |
| Nov 16 23:00:00 - 23:59:59 | 280 | 0.8% | 0.08 | 2.3 MB | 0.0% | 0.65 |
| Nov 17 00:00:00 - 00:59:59 | 7295 | 20.6% | 2.03 | 3.0 GB | 30.8% | 874.37 |
| Nov 17 01:00:00 - 01:59:59 | 341 | 1.0% | 0.09 | 1.1 MB | 0.0% | 0.33 |
| Nov 17 02:00:00 - 02:30:00 | 247 | 0.7% | 0.14 | 660.2 KB | 0.0% | 0.37 |
| TOTAL: 24:00:00 | 35360 | 100.0% | 0.41 | 9.7 GB | 100.0% | 118.25 |
Sites sending bad articles:
| Server | Total | Group | Dist | Duplic | Unapp | TooOld | Site | Line | Other | |
|---|---|---|---|---|---|---|---|---|---|---|
| 1 | feed1.usenet.blueworldhosting.com | 601 | 222 | 0 | 0 | 1 | 0 | 0 | 0 | 378 |
| TOTAL: 1 | 601 | 222 | 0 | 0 | 1 | 0 | 0 | 0 | 378 | |
Unwanted newsgroups [Top 20]:
| Newsgroup | Count |
|---|---|
| finet.binaries.keskustelu | 39 |
| alt.binaries.boneless | 25 |
| alt.binaries.nospam.female.bodyhair | 24 |
| alt.binaries.pictures.earlmiller | 13 |
| alt.binaries.pictures.scenic | 11 |
| alt.binaries.test.yenc | 11 |
| alt.binaries.pictures.purebeauty | 8 |
| panix.test | 8 |
| alt.binaries.sounds.mp3.christmas | 7 |
| alt.binaries.pictures.nude.celebrities.fake | 7 |
| wolfsburg.test | 5 |
| alt.binaries.games.adult | 3 |
| alt.binaries.pictures.tall-ships | 3 |
| alt.binaries.sounds.lossless | 3 |
| alt.binaries.pictures.wallpaper | 3 |
| alt.binaries.alt5 | 3 |
| alt.binaries.nospam.female.bodyhair.pubes | 3 |
| alt.binaries.sounds.lossless.jazz | 3 |
| ab.alt.binaries.moovee | 2 |
| alt.binaries.sounds.lossless.rock | 2 |
| TOTAL: 51 | 222 |
Supposedly-moderated groups with unmoderated postings [Top 20]:
| Groups | Count |
|---|---|
| soc.answers | 1 |
| TOTAL: 1 | 1 |
INND Python filter [Top 20]:
| Reason | Count |
|---|---|
| EMP Body Reject | 26 |
| Bad Subject (Solution manual ) | 13 |
| Bad Subject (Solution Manual ) | 8 |
| Bad Subject (Buy Weed Online) | 4 |
| Bad From (FBInCIAnNSATerroristSlayer@yahoo.com) | 3 |
| Bad Subject (Buy Xanax) | 3 |
| Bad Subject (LA_PARLAMENTARE_ASSASSINA) | 2 |
| TOTAL: 7 | 59 |
Miscellaneous innd statistics [Top 10]:
| Event | Server | Number |
|---|---|---|
| Including strange strings | ||
| feed1.usenet.blueworldhosting.com | 319 | |
| TOTAL: 1 | 319 | |
| TOTAL: 1 | 319 | |
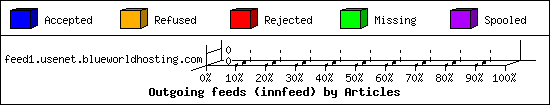
Outgoing Feeds (innfeed) by Articles:
| Server | Offered | Taken | Refused | Reject | Miss | Spool | %Took | Elapsed | |
|---|---|---|---|---|---|---|---|---|---|
| 1 | feed1.usenet.blueworldhosting.com | 0 | 0 | 0 | 0 | 0 | 0 | 0% | 00:10:00 |
| TOTAL: 1 | 0 | 0 | 0 | 0 | 0 | 0 | 0% | 00:10:00 | |
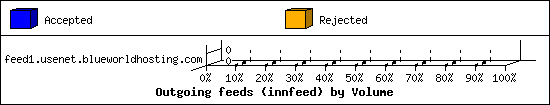
Outgoing Feeds (innfeed) by Volume:
| Server | AcceptVol | RejectVol | TotalVol | Volume/sec | Vol/Art | Elapsed | |
|---|---|---|---|---|---|---|---|
| 1 | feed1.usenet.blueworldhosting.com | 0.0 KB | 0.0 KB | 0.0 KB | 0.0 KB/s | 0 | 00:10:00 |
| TOTAL: 1 | 0.0 KB | 0.0 KB | 0.0 KB | 0.0 KB/s | 0 | 00:10:00 | |
NNRP readership statistics:
| System | Conn | Arts | Size | Groups | Post | Rej | Elapsed | |
|---|---|---|---|---|---|---|---|---|
| 1 | 023-084-030-207.res.spectrum.com | 5 | 54 | 21.0 MB | 5 | 0 | 0 | 00:08:31 |
| TOTAL: 1 | 5 | 54 | 21.0 MB | 5 | 0 | 0 | 22:51:14 | |
NNRP readership statistics (by domain):
| System | Conn | Arts | Size | Groups | Post | Rej | Elapsed | |
|---|---|---|---|---|---|---|---|---|
| 1 | *.res.spectrum.com | 5 | 54 | 21.0 MB | 5 | 0 | 0 | 00:08:31 |
| 2 | *.monitoring.internet-measurement.com | 1 | 0 | 0.0 KB | 0 | 0 | 0 | 00:00:07 |
| 3 | *.stehlik.co.uk | 929 | 0 | 0.0 KB | 0 | 0 | 0 | 22:42:35 |
| TOTAL: 3 | 935 | 54 | 21.0 MB | 5 | 0 | 0 | 22:51:14 | |
NNRP auth users [Top 20]:
| User | Conn |
|---|---|
| jesse | 5 |
| TOTAL: 1 | 5 |
NNRP total resource statistics [Top 20]:
| System | User(ms) | System(ms) | Idle(ms) | Elapsed |
|---|---|---|---|---|
| toma-03.stehlik.co.uk | 183.443 | 62.452 | 0.000 | 22:42:35 |
| 023-084-030-207.res.spectrum.com | 0.710 | 0.349 | 0.046 | 00:08:31 |
| great.monitoring.internet-measurement.com | 0.083 | 0.000 | 0.000 | 00:00:07 |
| TOTAL: 3 | 184.236 | 62.801 | 0.046 | 22:51:14 |
Curious NNRP server explorers [Top 20]:
| System | Conn |
|---|---|
| toma-03.stehlik.co.uk | 929 |
| great.monitoring.internet-measurement.com | 1 |
| TOTAL: 2 | 930 |
NNRP gethostbyaddr failures [Top 20]:
| System | Conn |
|---|---|
| ? (can't getpeername) | 1 |
| TOTAL: 1 | 1 |
NNRP client timeouts [Top 20]:
| System | Conn | Peer |
|---|---|---|
| 023-084-030-207.res.spectrum.com | 5 | 5 |
| toma-03.stehlik.co.uk | 3 | 3 |
| TOTAL: 2 | 8 | 9 |
Newsgroup request counts (by hierarchy):
| Hierarchy | Count | Pct | |
|---|---|---|---|
| 1 | alt | 54 | 100.0% |
| TOTAL: 1 | 54 | 100.0% | |
Newsgroup request counts (by newsgroup) [Top 100]:
| Newsgroup | Count | |
|---|---|---|
| 1 | alt.test | 35 |
| 2 | alt.binaries.multimedia.documentaries | 19 |
| TOTAL: 2 | 54 | |