Log entries by program:
| Program name | Lines | %Lines | Size | %Size |
|---|---|---|---|---|
| nnrpd | 58734 | 54.4% | 5.1 MB | 48.3% |
| inn | 47808 | 44.3% | 5.3 MB | 50.0% |
| innd | 1244 | 1.2% | 173.0 KB | 1.6% |
| innfeed | 155 | 0.1% | 14.2 KB | 0.1% |
| nocem | 2 | 0.0% | 0.2 KB | 0.0% |
| controlchan | 1 | 0.0% | 0.1 KB | 0.0% |
| TOTAL: 6 | 107944 | 100.0% | 10.5 MB | 100.0% |
History cache:
| Reason | Count | %Count |
|---|---|---|
| Do not exist | 47405 | 93.0% |
| Negative hits | 3570 | 7.0% |
| Positive hits | 11 | 0.0% |
| Cache misses | 4 | 0.0% |
| TOTAL: 4 | 50990 | 100.0% |
INND timer:
| Code region | Time | Pct | Invoked | Min(ms) | Avg(ms) | Max(ms) |
|---|---|---|---|---|---|---|
| article cancel | 00:00:00.336 | 0.0% | 69 | 0.000 | 4.870 | 15.000 |
| article cleanup | 00:00:00.476 | 0.0% | 47439 | 0.000 | 0.010 | 0.034 |
| article logging | 00:00:00.752 | 0.0% | 47813 | 0.000 | 0.016 | 0.057 |
| article parse | 00:00:32.685 | 0.0% | 2943100 | 0.000 | 0.011 | 0.042 |
| article write | 00:08:22.707 | 0.6% | 45104 | 1.800 | 11.146 | 16.294 |
| artlog/artcncl | 00:00:00.000 | 0.0% | 16 | 0.000 | 0.000 | 0.000 |
| data move | 00:00:03.662 | 0.0% | 3235173 | 0.000 | 0.001 | 0.019 |
| hisgrep/artcncl | 00:00:00.070 | 0.0% | 84 | 0.000 | 0.833 | 5.333 |
| hishave/artcncl | 00:00:00.000 | 0.0% | 16 | 0.000 | 0.000 | 0.000 |
| history grep | 00:00:00.000 | 0.0% | 0 | 0.000 | 0.000 | 0.000 |
| history lookup | 00:00:19.132 | 0.0% | 51009 | 0.062 | 0.375 | 1.152 |
| history sync | 00:00:14.909 | 0.0% | 408 | 0.000 | 36.542 | 132.000 |
| history write | 00:03:51.479 | 0.3% | 47439 | 0.333 | 4.880 | 7.045 |
| idle | 23:31:27.157 | 97.9% | 2937249 | 0.754 | 28.832 | 10918.109 |
| nntp read | 00:02:06.455 | 0.1% | 2936962 | 0.000 | 0.043 | 0.069 |
| overview write | 00:00:21.844 | 0.0% | 45104 | 0.130 | 0.484 | 5.391 |
| perl filter | 00:00:04.895 | 0.0% | 47338 | 0.000 | 0.103 | 0.181 |
| python filter | 00:13:39.067 | 0.9% | 47439 | 0.645 | 17.266 | 33.911 |
| site send | 00:00:01.324 | 0.0% | 45168 | 0.000 | 0.029 | 0.160 |
| TOTAL: 24:01:26.229 | 24:01:06.950 | 100.0% | - | - | - | - |
INNfeed timer:
| Code region | Time | Pct | Invoked | Min(ms) | Avg(ms) | Max(ms) |
|---|---|---|---|---|---|---|
| article new | 00:00:00.000 | 0.0% | 0 | 0.000 | 0.000 | 0.000 |
| article prepare | 00:00:00.000 | 0.0% | 0 | 0.000 | 0.000 | 0.000 |
| article read | 00:00:00.000 | 0.0% | 0 | 0.000 | 0.000 | 0.000 |
| backlog stats | 00:00:00.003 | 0.0% | 3729 | 0.000 | 0.001 | 0.038 |
| callbacks | 00:00:00.000 | 0.0% | 0 | 0.000 | 0.000 | 0.000 |
| data read | 00:00:00.000 | 0.0% | 3 | 0.000 | 0.000 | 0.000 |
| data write | 00:00:00.000 | 0.0% | 3 | 0.000 | 0.000 | 0.000 |
| idle | 23:56:13.495 | 100.0% | 3729 | 17680.294 | 23109.009 | 24126.280 |
| status file | 00:00:00.000 | 0.0% | 6 | 0.000 | 0.000 | 0.000 |
| TOTAL: 23:56:13.546 | 23:56:13.498 | 100.0% | - | - | - | - |
nnrpd timer:
| Code region | Time | Pct | Invoked | Min(ms) | Avg(ms) | Max(ms) |
|---|---|---|---|---|---|---|
| idle | 00:00:00.000 | 0.0% | 0 | 0.000 | 0.000 | 0.000 |
| newnews | 00:00:00.000 | 0.0% | 0 | 0.000 | 0.000 | 0.000 |
| nntpwrite | 00:30:56.919 | 2.3% | 13335156 | 0.000 | 0.139 | 49.500 |
| readart | 00:00:00.040 | 0.0% | 10 | 4.000 | 4.000 | 4.000 |
| TOTAL: 22:51:23.434 | 00:30:56.959 | 2.3% | - | - | - | - |
Control commands to INND:
| Command | Number |
|---|---|
| flush | 5 |
| flushlogs | 2 |
| go | 1 |
| logmode | 2 |
| mode | 149 |
| name | 2 |
| pause | 1 |
| paused | 1 |
| reload | 2 |
| renumber | 1 |
| TOTAL: 10 | 166 |
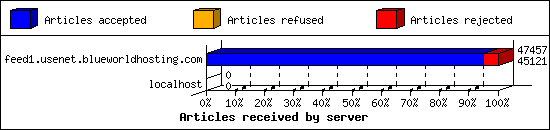
Incoming Feeds (INN):
| Server | Connects | Offered | Taken | Refused | Reject | %Accpt | Elapsed | |
|---|---|---|---|---|---|---|---|---|
| 1 | feed1.usenet.blueworldhosting.com | 17 | 47457 | 45121 | 0 | 2336 | 95% | 25:28:38 |
| 2 | localhost | 1 | 0 | 0 | 0 | 0 | 0% | 00:00:00 |
| TOTAL: 2 | 18 | 47457 | 45121 | 0 | 2336 | 95% | 25:28:38 | |
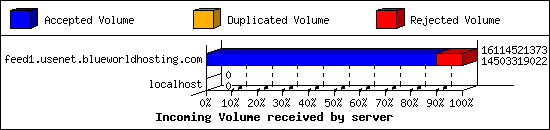
Incoming Volume (INN):
| Server | AcceptVol | DupVol | RejVol | TotalVol | %Acc | Vol/Art | |
|---|---|---|---|---|---|---|---|
| 1 | feed1.usenet.blueworldhosting.com | 13.5 GB | 0.0 KB | 1.5 GB | 15.0 GB | 90% | 331.6 KB |
| 2 | localhost | 0.0 KB | 0.0 KB | 0.0 KB | 0.0 KB | 0% | 0 |
| TOTAL: 2 | 13.5 GB | 0.0 KB | 1.5 GB | 15.0 GB | 90% | 331.6 KB | |
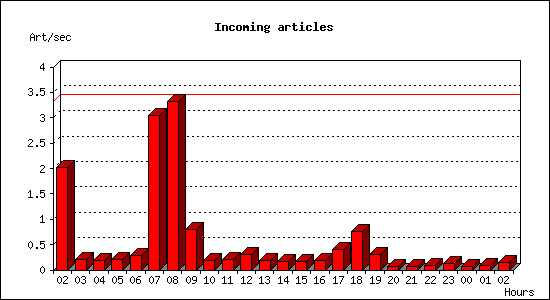
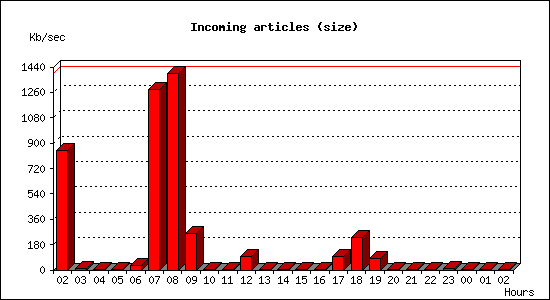
Incoming articles:
| Date | Articles | %Arts | Art/sec | Size | %Size | KB/sec |
|---|---|---|---|---|---|---|
| Dec 1 02:30:00 - 02:59:59 | 3652 | 8.1% | 2.03 | 1.5 GB | 10.7% | 845.72 |
| Dec 1 03:00:00 - 03:59:59 | 775 | 1.7% | 0.22 | 47.6 MB | 0.3% | 13.55 |
| Dec 1 04:00:00 - 04:59:59 | 673 | 1.5% | 0.19 | 1.8 MB | 0.0% | 0.51 |
| Dec 1 05:00:00 - 05:59:59 | 734 | 1.6% | 0.20 | 2.6 MB | 0.0% | 0.74 |
| Dec 1 06:00:00 - 06:59:59 | 1047 | 2.3% | 0.29 | 117.2 MB | 0.8% | 33.34 |
| Dec 1 07:00:00 - 07:59:59 | 10936 | 24.3% | 3.04 | 4.4 GB | 32.5% | 1278.17 |
| Dec 1 08:00:00 - 08:59:59 | 11933 | 26.5% | 3.31 | 4.8 GB | 35.5% | 1397.05 |
| Dec 1 09:00:00 - 09:59:59 | 2839 | 6.3% | 0.79 | 907.7 MB | 6.6% | 258.18 |
| Dec 1 10:00:00 - 10:59:59 | 699 | 1.6% | 0.19 | 3.5 MB | 0.0% | 0.99 |
| Dec 1 11:00:00 - 11:59:59 | 744 | 1.7% | 0.21 | 2.2 MB | 0.0% | 0.61 |
| Dec 1 12:00:00 - 12:59:59 | 1106 | 2.5% | 0.31 | 327.1 MB | 2.4% | 93.03 |
| Dec 1 13:00:00 - 13:59:59 | 646 | 1.4% | 0.18 | 2.1 MB | 0.0% | 0.59 |
| Dec 1 14:00:00 - 14:59:59 | 574 | 1.3% | 0.16 | 1.8 MB | 0.0% | 0.53 |
| Dec 1 15:00:00 - 15:59:59 | 618 | 1.4% | 0.17 | 1.8 MB | 0.0% | 0.51 |
| Dec 1 16:00:00 - 16:59:59 | 679 | 1.5% | 0.19 | 9.5 MB | 0.1% | 2.71 |
| Dec 1 17:00:00 - 17:59:59 | 1473 | 3.3% | 0.41 | 343.0 MB | 2.5% | 97.57 |
| Dec 1 18:00:00 - 18:59:59 | 2728 | 6.1% | 0.76 | 817.1 MB | 5.9% | 232.43 |
| Dec 1 19:00:00 - 19:59:59 | 1105 | 2.5% | 0.31 | 280.1 MB | 2.0% | 79.67 |
| Dec 1 20:00:00 - 20:59:59 | 262 | 0.6% | 0.07 | 1.0 MB | 0.0% | 0.29 |
| Dec 1 21:00:00 - 21:59:59 | 264 | 0.6% | 0.07 | 962.7 KB | 0.0% | 0.27 |
| Dec 1 22:00:00 - 22:59:59 | 284 | 0.6% | 0.08 | 24.2 MB | 0.2% | 6.89 |
| Dec 1 23:00:00 - 23:59:59 | 464 | 1.0% | 0.13 | 42.2 MB | 0.3% | 12.00 |
| Dec 2 00:00:00 - 00:59:59 | 265 | 0.6% | 0.07 | 968.1 KB | 0.0% | 0.27 |
| Dec 2 01:00:00 - 01:59:59 | 328 | 0.7% | 0.09 | 3.9 MB | 0.0% | 1.10 |
| Dec 2 02:00:00 - 02:30:00 | 257 | 0.6% | 0.14 | 730.0 KB | 0.0% | 0.41 |
| TOTAL: 24:00:00 | 45085 | 100.0% | 0.52 | 13.5 GB | 100.0% | 163.92 |
Sites sending bad articles:
| Server | Total | Group | Dist | Duplic | Unapp | TooOld | Site | Line | Other | |
|---|---|---|---|---|---|---|---|---|---|---|
| 1 | feed1.usenet.blueworldhosting.com | 2708 | 2234 | 0 | 0 | 0 | 0 | 0 | 0 | 474 |
| TOTAL: 1 | 2708 | 2234 | 0 | 0 | 0 | 0 | 0 | 0 | 474 | |
Unwanted newsgroups [Top 20]:
| Newsgroup | Count |
|---|---|
| alt.bin | 2045 |
| finet.binaries.keskustelu | 56 |
| alt.binaries.nospam.female.bodyhair.pubes | 15 |
| alt.binaries.nospam.female.bodyhair | 13 |
| alt.binaries.sounds.karaoke | 12 |
| alt.binaries.pictures.purebeauty | 10 |
| alt.binaries.test.yenc | 8 |
| harvard.forsale | 7 |
| alt.binaries.pictures.nude.celebrities.fake | 7 |
| alt.binaries.sounds.mp3.christmas | 6 |
| alt.binaries.pictures.scenic | 5 |
| alt.binaries.pictures.earlmiller | 5 |
| alt.binaries.drwho | 5 |
| alt.binaries.adan | 4 |
| alt.binaries.emulators.mame | 3 |
| alt.binaries.sounds.lossless.jazz | 2 |
| alt.binaries.multimedia.videos.music | 2 |
| tor.forsale | 2 |
| alt.binaries.pictures.nude | 2 |
| alt.binaries.amazing | 2 |
| TOTAL: 42 | 2234 |
INND Python filter [Top 20]:
| Reason | Count |
|---|---|
| EMP Body Reject | 75 |
| Bad Subject (Solution manual ) | 12 |
| Bad Subject (Buy Xanax) | 4 |
| Bad Subject (Solution Manual ) | 4 |
| Bad Subject (Buy Adderall) | 2 |
| Bad Subject (Buy Cocaine) | 1 |
| Bad From (FBInCIAnNSATerroristSlayer@yahoo.com) | 1 |
| Bad Subject (Buy Hydrocodone) | 1 |
| Bad From (bodybuildingpharma59@gmail.com) | 1 |
| TOTAL: 9 | 101 |
NoCeM on Spool:
| Id | Good | Bad | Unique | Total |
|---|---|---|---|---|
| bleachbot@httrack.com | 1 | 0 | 1 | 1 |
| TOTAL: 1 | 1 | 0 | 1 | 1 |
Miscellaneous innd statistics [Top 10]:
| Event | Server | Number |
|---|---|---|
| Including strange strings | ||
| feed1.usenet.blueworldhosting.com | 373 | |
| TOTAL: 1 | 373 | |
| TOTAL: 1 | 373 | |
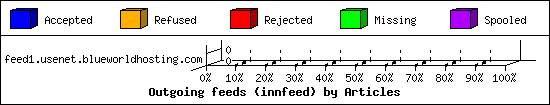
Outgoing Feeds (innfeed) by Articles:
| Server | Offered | Taken | Refused | Reject | Miss | Spool | %Took | Elapsed | |
|---|---|---|---|---|---|---|---|---|---|
| 1 | feed1.usenet.blueworldhosting.com | 0 | 0 | 0 | 0 | 0 | 0 | 0% | 00:10:00 |
| TOTAL: 1 | 0 | 0 | 0 | 0 | 0 | 0 | 0% | 00:10:00 | |
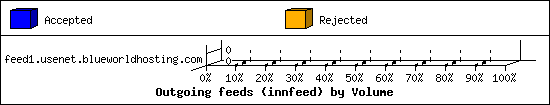
Outgoing Feeds (innfeed) by Volume:
| Server | AcceptVol | RejectVol | TotalVol | Volume/sec | Vol/Art | Elapsed | |
|---|---|---|---|---|---|---|---|
| 1 | feed1.usenet.blueworldhosting.com | 0.0 KB | 0.0 KB | 0.0 KB | 0.0 KB/s | 0 | 00:10:00 |
| TOTAL: 1 | 0.0 KB | 0.0 KB | 0.0 KB | 0.0 KB/s | 0 | 00:10:00 | |
NNRP readership statistics:
| System | Conn | Arts | Size | Groups | Post | Rej | Elapsed | |
|---|---|---|---|---|---|---|---|---|
| 1 | 219.141.106.251 | 3 | 10 | 28.7 KB | 3 | 0 | 2 | 00:23:23 |
| TOTAL: 1 | 3 | 10 | 28.7 KB | 3 | 0 | 2 | 22:51:18 | |
NNRP readership statistics (by domain):
| System | Conn | Arts | Size | Groups | Post | Rej | Elapsed | |
|---|---|---|---|---|---|---|---|---|
| 1 | unresolved | 3 | 10 | 28.7 KB | 3 | 0 | 2 | 00:23:23 |
| 2 | *.stehlik.co.uk | 915 | 0 | 0.0 KB | 0 | 0 | 0 | 22:24:53 |
| 3 | *.res.spectrum.com | 6 | 0 | 0.0 KB | 0 | 0 | 0 | 00:03:02 |
| TOTAL: 3 | 924 | 10 | 28.7 KB | 3 | 0 | 2 | 22:51:18 | |
NNRP auth users [Top 20]:
| User | Conn |
|---|---|
| jesse | 6 |
| TOTAL: 1 | 6 |
NNRP total resource statistics [Top 20]:
| System | User(ms) | System(ms) | Idle(ms) | Elapsed |
|---|---|---|---|---|
| toma-03.stehlik.co.uk | 180.711 | 63.674 | 0.000 | 22:24:53 |
| 219.141.106.251 | 0.267 | 0.023 | 0.000 | 00:23:23 |
| 023-084-030-207.res.spectrum.com | 0.488 | 0.123 | 0.036 | 00:03:02 |
| TOTAL: 3 | 181.466 | 63.820 | 0.036 | 22:51:18 |
Curious NNRP server explorers [Top 20]:
| System | Conn |
|---|---|
| toma-03.stehlik.co.uk | 915 |
| 023-084-030-207.res.spectrum.com | 6 |
| TOTAL: 2 | 921 |
NNRP client timeouts [Top 20]:
| System | Conn | Peer |
|---|---|---|
| 023-084-030-207.res.spectrum.com | 6 | 6 |
| toma-03.stehlik.co.uk | 4 | 4 |
| TOTAL: 2 | 10 | 10 |
Newsgroup request counts (by hierarchy):
| Hierarchy | Count | Pct | |
|---|---|---|---|
| 1 | cn | 10 | 100.0% |
| TOTAL: 1 | 10 | 100.0% | |
Newsgroup request counts (by newsgroup) [Top 100]:
| Newsgroup | Count | |
|---|---|---|
| 1 | cn.test | 8 |
| 2 | cn.fan | 2 |
| TOTAL: 2 | 10 | |