Log entries by program:
| Program name | Lines | %Lines | Size | %Size |
|---|---|---|---|---|
| inn | 91409 | 58.9% | 10.9 MB | 66.0% |
| nnrpd | 62260 | 40.1% | 5.4 MB | 32.8% |
| innd | 1453 | 0.9% | 189.6 KB | 1.1% |
| innfeed | 157 | 0.1% | 14.2 KB | 0.1% |
| controlchan | 1 | 0.0% | 0.1 KB | 0.0% |
| nocem | 1 | 0.0% | 0.1 KB | 0.0% |
| TOTAL: 6 | 155281 | 100.0% | 16.5 MB | 100.0% |
History cache:
| Reason | Count | %Count |
|---|---|---|
| Do not exist | 90854 | 98.5% |
| Negative hits | 1369 | 1.5% |
| Positive hits | 8 | 0.0% |
| Cache misses | 0 | 0.0% |
| TOTAL: 4 | 92231 | 100.0% |
INND timer:
| Code region | Time | Pct | Invoked | Min(ms) | Avg(ms) | Max(ms) |
|---|---|---|---|---|---|---|
| article cancel | 00:00:00.242 | 0.0% | 43 | 0.000 | 5.628 | 28.000 |
| article cleanup | 00:00:00.917 | 0.0% | 91001 | 0.000 | 0.010 | 0.062 |
| article logging | 00:00:01.525 | 0.0% | 91292 | 0.000 | 0.017 | 0.091 |
| article parse | 00:01:09.594 | 0.1% | 5524540 | 0.000 | 0.013 | 0.049 |
| article write | 00:50:53.571 | 3.5% | 90773 | 0.588 | 33.640 | 97.584 |
| artlog/artcncl | 00:00:00.000 | 0.0% | 6 | 0.000 | 0.000 | 0.000 |
| data move | 00:00:10.398 | 0.0% | 6147662 | 0.000 | 0.002 | 0.023 |
| hisgrep/artcncl | 00:00:00.046 | 0.0% | 49 | 0.000 | 0.939 | 6.000 |
| hishave/artcncl | 00:00:00.000 | 0.0% | 6 | 0.000 | 0.000 | 0.000 |
| history grep | 00:00:00.000 | 0.0% | 0 | 0.000 | 0.000 | 0.000 |
| history lookup | 00:00:30.031 | 0.0% | 92372 | 0.000 | 0.325 | 4.610 |
| history sync | 00:00:22.552 | 0.0% | 334 | 0.000 | 67.521 | 127.000 |
| history write | 00:16:39.423 | 1.2% | 91001 | 4.226 | 10.983 | 18.050 |
| idle | 22:16:00.617 | 92.7% | 5308046 | 0.266 | 15.102 | 15371.308 |
| nntp read | 00:04:57.193 | 0.3% | 5488641 | 0.000 | 0.054 | 0.086 |
| overview write | 00:00:37.270 | 0.0% | 90773 | 0.111 | 0.411 | 9.460 |
| perl filter | 00:00:10.371 | 0.0% | 90934 | 0.000 | 0.114 | 0.208 |
| python filter | 00:28:31.044 | 2.0% | 91001 | 0.630 | 18.802 | 34.852 |
| site send | 00:00:02.719 | 0.0% | 90836 | 0.000 | 0.030 | 0.250 |
| TOTAL: 24:00:46.041 | 24:00:07.513 | 100.0% | - | - | - | - |
INNfeed timer:
| Code region | Time | Pct | Invoked | Min(ms) | Avg(ms) | Max(ms) |
|---|---|---|---|---|---|---|
| article new | 00:00:00.000 | 0.0% | 0 | 0.000 | 0.000 | 0.000 |
| article prepare | 00:00:00.000 | 0.0% | 0 | 0.000 | 0.000 | 0.000 |
| article read | 00:00:00.000 | 0.0% | 0 | 0.000 | 0.000 | 0.000 |
| backlog stats | 00:00:00.002 | 0.0% | 3729 | 0.000 | 0.001 | 0.038 |
| callbacks | 00:00:00.000 | 0.0% | 0 | 0.000 | 0.000 | 0.000 |
| data read | 00:00:00.000 | 0.0% | 3 | 0.000 | 0.000 | 0.000 |
| data write | 00:00:00.001 | 0.0% | 3 | 0.000 | 0.333 | 0.500 |
| idle | 23:57:15.952 | 100.0% | 3729 | 17902.147 | 23125.758 | 25124.208 |
| status file | 00:00:00.003 | 0.0% | 6 | 0.250 | 0.500 | 1.000 |
| TOTAL: 23:57:15.996 | 23:57:15.958 | 100.0% | - | - | - | - |
nnrpd timer:
| Code region | Time | Pct | Invoked | Min(ms) | Avg(ms) | Max(ms) |
|---|---|---|---|---|---|---|
| hisgrep | 00:00:00.007 | 0.0% | 4 | 0.000 | 1.750 | 7.000 |
| idle | 00:00:00.000 | 0.0% | 0 | 0.000 | 0.000 | 0.000 |
| newnews | 00:00:00.000 | 0.0% | 0 | 0.000 | 0.000 | 0.000 |
| nntpwrite | 00:34:32.116 | 2.1% | 14292671 | 0.000 | 0.145 | 137.733 |
| readart | 00:00:00.065 | 0.0% | 4 | 0.000 | 16.250 | 64.000 |
| TOTAL: 27:11:11.351 | 00:34:32.188 | 2.1% | - | - | - | - |
Control commands to INND:
| Command | Number |
|---|---|
| flush | 5 |
| flushlogs | 2 |
| go | 1 |
| logmode | 2 |
| mode | 149 |
| name | 2 |
| pause | 1 |
| paused | 1 |
| reload | 2 |
| renumber | 1 |
| TOTAL: 10 | 166 |
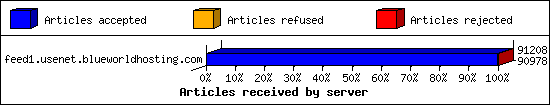
Incoming Feeds (INN):
| Server | Connects | Offered | Taken | Refused | Reject | %Accpt | Elapsed | |
|---|---|---|---|---|---|---|---|---|
| 1 | feed1.usenet.blueworldhosting.com | 31 | 91208 | 90978 | 2 | 228 | 99% | 26:55:35 |
| TOTAL: 1 | 31 | 91208 | 90978 | 2 | 228 | 99% | 26:55:35 | |
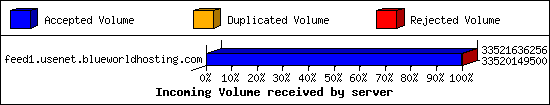
Incoming Volume (INN):
| Server | AcceptVol | DupVol | RejVol | TotalVol | %Acc | Vol/Art | |
|---|---|---|---|---|---|---|---|
| 1 | feed1.usenet.blueworldhosting.com | 31.2 GB | 0.0 KB | 1.4 MB | 31.2 GB | 99% | 358.9 KB |
| TOTAL: 1 | 31.2 GB | 0.0 KB | 1.4 MB | 31.2 GB | 99% | 358.9 KB | |
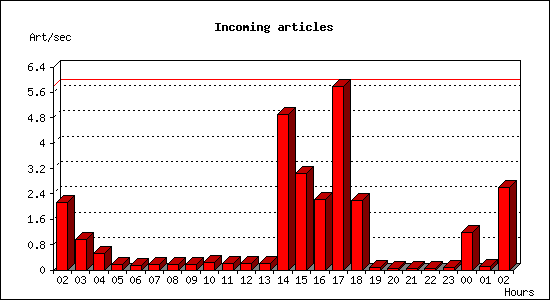
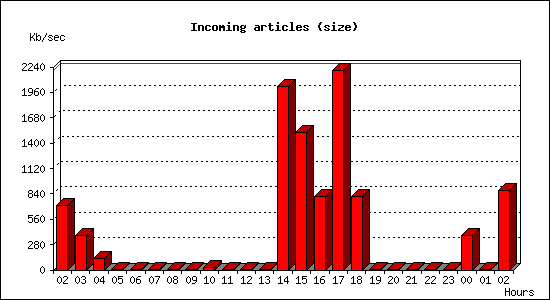
Incoming articles:
| Date | Articles | %Arts | Art/sec | Size | %Size | KB/sec |
|---|---|---|---|---|---|---|
| Dec 11 02:30:00 - 02:59:59 | 3815 | 4.2% | 2.12 | 1.2 GB | 3.9% | 716.48 |
| Dec 11 03:00:00 - 03:59:59 | 3414 | 3.8% | 0.95 | 1.3 GB | 4.2% | 383.17 |
| Dec 11 04:00:00 - 04:59:59 | 1882 | 2.1% | 0.52 | 445.5 MB | 1.4% | 126.71 |
| Dec 11 05:00:00 - 05:59:59 | 604 | 0.7% | 0.17 | 1.5 MB | 0.0% | 0.43 |
| Dec 11 06:00:00 - 06:59:59 | 495 | 0.5% | 0.14 | 1.4 MB | 0.0% | 0.39 |
| Dec 11 07:00:00 - 07:59:59 | 624 | 0.7% | 0.17 | 2.0 MB | 0.0% | 0.57 |
| Dec 11 08:00:00 - 08:59:59 | 591 | 0.7% | 0.16 | 1.8 MB | 0.0% | 0.52 |
| Dec 11 09:00:00 - 09:59:59 | 635 | 0.7% | 0.18 | 5.9 MB | 0.0% | 1.68 |
| Dec 11 10:00:00 - 10:59:59 | 871 | 1.0% | 0.24 | 91.9 MB | 0.3% | 26.14 |
| Dec 11 11:00:00 - 11:59:59 | 702 | 0.8% | 0.20 | 5.1 MB | 0.0% | 1.44 |
| Dec 11 12:00:00 - 12:59:59 | 699 | 0.8% | 0.19 | 2.3 MB | 0.0% | 0.67 |
| Dec 11 13:00:00 - 13:59:59 | 747 | 0.8% | 0.21 | 3.0 MB | 0.0% | 0.85 |
| Dec 11 14:00:00 - 14:59:59 | 17672 | 19.4% | 4.91 | 7.0 GB | 22.3% | 2030.31 |
| Dec 11 15:00:00 - 15:59:59 | 10898 | 12.0% | 3.03 | 5.2 GB | 16.7% | 1515.09 |
| Dec 11 16:00:00 - 16:59:59 | 8051 | 8.9% | 2.24 | 2.8 GB | 8.9% | 809.49 |
| Dec 11 17:00:00 - 17:59:59 | 20813 | 22.9% | 5.78 | 7.6 GB | 24.2% | 2202.99 |
| Dec 11 18:00:00 - 18:59:59 | 7926 | 8.7% | 2.20 | 2.8 GB | 8.9% | 806.26 |
| Dec 11 19:00:00 - 19:59:59 | 240 | 0.3% | 0.07 | 1.2 MB | 0.0% | 0.35 |
| Dec 11 20:00:00 - 20:59:59 | 173 | 0.2% | 0.05 | 1.3 MB | 0.0% | 0.37 |
| Dec 11 21:00:00 - 21:59:59 | 162 | 0.2% | 0.04 | 745.1 KB | 0.0% | 0.21 |
| Dec 11 22:00:00 - 22:59:59 | 220 | 0.2% | 0.06 | 1.2 MB | 0.0% | 0.34 |
| Dec 11 23:00:00 - 23:59:59 | 326 | 0.4% | 0.09 | 1.8 MB | 0.0% | 0.52 |
| Dec 12 00:00:00 - 00:59:59 | 4272 | 4.7% | 1.19 | 1.3 GB | 4.2% | 384.52 |
| Dec 12 01:00:00 - 01:59:59 | 368 | 0.4% | 0.10 | 1.2 MB | 0.0% | 0.35 |
| Dec 12 02:00:00 - 02:30:00 | 4687 | 5.2% | 2.60 | 1.5 GB | 4.8% | 872.96 |
| TOTAL: 24:00:00 | 90887 | 100.0% | 1.05 | 31.2 GB | 100.0% | 378.67 |
Sites sending bad articles:
| Server | Total | Group | Dist | Duplic | Unapp | TooOld | Site | Line | Other | |
|---|---|---|---|---|---|---|---|---|---|---|
| 1 | feed1.usenet.blueworldhosting.com | 516 | 158 | 0 | 0 | 2 | 0 | 0 | 0 | 356 |
| TOTAL: 1 | 516 | 158 | 0 | 0 | 2 | 0 | 0 | 0 | 356 | |
Unwanted newsgroups [Top 20]:
| Newsgroup | Count |
|---|---|
| alt.binaries.pictures.purebeauty | 19 |
| finet.binaries.keskustelu | 18 |
| alt.binaries.pictures.wallpaper | 15 |
| alt.binaries.sounds.mp3.new-age | 9 |
| alt.binaries.pictures.nude | 8 |
| alt.binaries.test.yenc | 7 |
| alt.binaries.sounds.lossless.classical | 7 |
| alt.binaries.sounds.karaoke | 5 |
| alt.binaries.pictures.nude.celebrities.fake | 5 |
| alt.binaries.pictures.earlmiller | 4 |
| alt.binaries.nospam.female.bodyhair | 4 |
| alt.binaries.pictures.fashion.youth | 4 |
| alt.binaries.sounds.lossless | 3 |
| alt.binaries.multimedia.vintage-film.post-1960 | 3 |
| alt.binaries.pictures.scenic | 3 |
| alt.binaries.mp3.audiobooks | 3 |
| alt.binaries.adan | 2 |
| gun.general | 2 |
| alt.binaries.pictures.rail | 2 |
| wolfsburg.test | 2 |
| TOTAL: 47 | 158 |
Supposedly-moderated groups with unmoderated postings [Top 20]:
| Groups | Count |
|---|---|
| perl.beginners | 1 |
| bit.listserv.catholic | 1 |
| TOTAL: 2 | 2 |
INND Python filter [Top 20]:
| Reason | Count |
|---|---|
| EMP Body Reject | 35 |
| Bad Subject (Solution manual ) | 11 |
| Bad From (FBInCIAnNSATerroristSlayer@yahoo.com) | 7 |
| Bad Subject (Solution Manual ) | 6 |
| Bad Subject (Buy Magic Mushrooms) | 6 |
| Bad Subject (Buy adderall) | 1 |
| Bad Subject (Buy psychedelics) | 1 |
| TOTAL: 7 | 67 |
Miscellaneous innd statistics [Top 10]:
| Event | Server | Number |
|---|---|---|
| Including strange strings | ||
| feed1.usenet.blueworldhosting.com | 289 | |
| TOTAL: 1 | 289 | |
| TOTAL: 1 | 289 | |
Outgoing Feeds (innfeed) by Articles:
| Server | Offered | Taken | Refused | Reject | Miss | Spool | %Took | Elapsed | |
|---|---|---|---|---|---|---|---|---|---|
| 1 | feed1.usenet.blueworldhosting.com | 0 | 0 | 0 | 0 | 0 | 0 | 0% | 00:10:00 |
| TOTAL: 1 | 0 | 0 | 0 | 0 | 0 | 0 | 0% | 00:10:00 | |
Outgoing Feeds (innfeed) by Volume:
| Server | AcceptVol | RejectVol | TotalVol | Volume/sec | Vol/Art | Elapsed | |
|---|---|---|---|---|---|---|---|
| 1 | feed1.usenet.blueworldhosting.com | 0.0 KB | 0.0 KB | 0.0 KB | 0.0 KB/s | 0 | 00:10:00 |
| TOTAL: 1 | 0.0 KB | 0.0 KB | 0.0 KB | 0.0 KB/s | 0 | 00:10:00 | |
NNRP readership statistics:
| System | Conn | Arts | Size | Groups | Post | Rej | Elapsed | |
|---|---|---|---|---|---|---|---|---|
| 1 | 023-084-030-207.res.spectrum.com | 132 | 4 | 5.2 KB | 1 | 0 | 0 | 01:12:12 |
| TOTAL: 1 | 132 | 4 | 5.2 KB | 1 | 0 | 0 | 27:11:05 | |
NNRP readership statistics (by domain):
| System | Conn | Arts | Size | Groups | Post | Rej | Elapsed | |
|---|---|---|---|---|---|---|---|---|
| 1 | *.res.spectrum.com | 132 | 4 | 5.2 KB | 1 | 0 | 0 | 01:12:12 |
| 2 | *.stehlik.co.uk | 976 | 0 | 0.0 KB | 0 | 0 | 0 | 25:58:51 |
| 3 | *.hsd1.il.comcast.net | 1 | 0 | 0.0 KB | 0 | 0 | 0 | 00:00:01 |
| TOTAL: 3 | 1109 | 4 | 5.2 KB | 1 | 0 | 0 | 27:11:05 | |
NNRP auth users [Top 20]:
| User | Conn |
|---|---|
| jesse | 132 |
| TOTAL: 1 | 132 |
NNRP total resource statistics [Top 20]:
| System | User(ms) | System(ms) | Idle(ms) | Elapsed |
|---|---|---|---|---|
| toma-03.stehlik.co.uk | 194.331 | 71.707 | 0.000 | 25:58:51 |
| 023-084-030-207.res.spectrum.com | 10.910 | 2.437 | 0.905 | 01:12:12 |
| c-73-208-203-252.hsd1.il.comcast.net | 0.061 | 0.026 | 0.000 | 00:00:01 |
| TOTAL: 3 | 205.302 | 74.170 | 0.905 | 27:11:05 |
Curious NNRP server explorers [Top 20]:
| System | Conn |
|---|---|
| toma-03.stehlik.co.uk | 976 |
| c-73-208-203-252.hsd1.il.comcast.net | 1 |
| TOTAL: 2 | 977 |
NNRP client timeouts [Top 20]:
| System | Conn | Peer |
|---|---|---|
| 023-084-030-207.res.spectrum.com | 132 | 132 |
| toma-03.stehlik.co.uk | 18 | 17 |
| TOTAL: 2 | 150 | 149 |
Newsgroup request counts (by hierarchy):
| Hierarchy | Count | Pct | |
|---|---|---|---|
| 1 | alt | 1 | 100.0% |
| TOTAL: 1 | 1 | 100.0% | |
Newsgroup request counts (by newsgroup) [Top 100]:
| Newsgroup | Count | |
|---|---|---|
| 1 | alt.binaries.multimedia.documentaries | 1 |
| TOTAL: 1 | 1 | |