Unknown entries from news log file:
First 9 / 9 lines (100.0%)
Log entries by program:
| Program name | Lines | %Lines | Size | %Size |
|---|---|---|---|---|
| inn | 31997 | 51.6% | 3.6 MB | 59.3% |
| nnrpd | 29309 | 47.2% | 2.4 MB | 39.2% |
| innd | 639 | 1.0% | 84.5 KB | 1.4% |
| innfeed | 87 | 0.1% | 7.8 KB | 0.1% |
| controlchan | 13 | 0.0% | 2.5 KB | 0.0% |
| nocem | 1 | 0.0% | 0.1 KB | 0.0% |
| TOTAL: 6 | 62046 | 100.0% | 6.0 MB | 100.0% |
History cache:
| Reason | Count | %Count |
|---|---|---|
| Do not exist | 31741 | 99.4% |
| Negative hits | 183 | 0.6% |
| Positive hits | 4 | 0.0% |
| Cache misses | 3 | 0.0% |
| TOTAL: 4 | 31931 | 100.0% |
INND timer:
| Code region | Time | Pct | Invoked | Min(ms) | Avg(ms) | Max(ms) |
|---|---|---|---|---|---|---|
| article cancel | 00:00:00.051 | 0.0% | 29 | 0.000 | 1.759 | 11.000 |
| article cleanup | 00:00:00.305 | 0.0% | 31769 | 0.000 | 0.010 | 0.040 |
| article logging | 00:00:00.493 | 0.0% | 31965 | 0.000 | 0.015 | 0.055 |
| article parse | 00:00:21.031 | 0.0% | 1871042 | 0.000 | 0.011 | 0.036 |
| article write | 00:05:29.155 | 0.7% | 31642 | 3.144 | 10.402 | 20.488 |
| artlog/artcncl | 00:00:00.000 | 0.0% | 7 | 0.000 | 0.000 | 0.000 |
| data move | 00:00:02.641 | 0.0% | 2073865 | 0.000 | 0.001 | 0.015 |
| hisgrep/artcncl | 00:00:00.009 | 0.0% | 36 | 0.000 | 0.250 | 1.167 |
| hishave/artcncl | 00:00:00.001 | 0.0% | 7 | 0.000 | 0.143 | 1.000 |
| history grep | 00:00:00.000 | 0.0% | 0 | 0.000 | 0.000 | 0.000 |
| history lookup | 00:00:00.551 | 0.0% | 31980 | 0.000 | 0.017 | 0.066 |
| history sync | 00:00:11.280 | 0.0% | 162 | 0.000 | 69.630 | 84.000 |
| history write | 00:04:00.598 | 0.5% | 31769 | 5.517 | 7.573 | 8.553 |
| idle | 11:59:40.729 | 97.2% | 1864650 | 0.824 | 23.158 | 5349.545 |
| nntp read | 00:01:23.371 | 0.2% | 1864550 | 0.000 | 0.045 | 0.077 |
| overview write | 00:00:08.870 | 0.0% | 31642 | 0.129 | 0.280 | 4.039 |
| perl filter | 00:00:03.222 | 0.0% | 31742 | 0.000 | 0.102 | 0.158 |
| python filter | 00:08:44.366 | 1.2% | 31769 | 0.643 | 16.506 | 29.932 |
| site send | 00:00:00.893 | 0.0% | 31694 | 0.000 | 0.028 | 0.156 |
| TOTAL: 12:20:19.825 | 12:20:07.566 | 100.0% | - | - | - | - |
INNfeed timer:
| Code region | Time | Pct | Invoked | Min(ms) | Avg(ms) | Max(ms) |
|---|---|---|---|---|---|---|
| article new | 00:00:00.000 | 0.0% | 0 | 0.000 | 0.000 | 0.000 |
| article prepare | 00:00:00.000 | 0.0% | 0 | 0.000 | 0.000 | 0.000 |
| article read | 00:00:00.000 | 0.0% | 0 | 0.000 | 0.000 | 0.000 |
| backlog stats | 00:00:00.003 | 0.0% | 1909 | 0.000 | 0.002 | 0.115 |
| callbacks | 00:00:00.000 | 0.0% | 0 | 0.000 | 0.000 | 0.000 |
| data read | 00:00:00.000 | 0.0% | 3 | 0.000 | 0.000 | 0.000 |
| data write | 00:00:00.000 | 0.0% | 3 | 0.000 | 0.000 | 0.000 |
| idle | 12:12:25.313 | 100.0% | 1909 | 17650.706 | 23020.070 | 24039.600 |
| status file | 00:00:00.001 | 0.0% | 6 | 0.000 | 0.167 | 0.250 |
| TOTAL: 12:12:25.350 | 12:12:25.317 | 100.0% | - | - | - | - |
nnrpd timer:
| Code region | Time | Pct | Invoked | Min(ms) | Avg(ms) | Max(ms) |
|---|---|---|---|---|---|---|
| idle | 00:00:00.000 | 0.0% | 0 | 0.000 | 0.000 | 0.000 |
| newnews | 00:00:00.000 | 0.0% | 0 | 0.000 | 0.000 | 0.000 |
| nntpwrite | 00:18:00.827 | 2.3% | 8102176 | 0.000 | 0.133 | 102.818 |
| TOTAL: 13:10:34.071 | 00:18:00.827 | 2.3% | - | - | - | - |
Control commands to INND:
| Command | Number |
|---|---|
| flush | 4 |
| flushlogs | 2 |
| go | 1 |
| logmode | 2 |
| mode | 79 |
| name | 2 |
| pause | 1 |
| paused | 1 |
| renumber | 1 |
| TOTAL: 9 | 93 |
Control Channel:
| Sender | newgroup | rmgroup | Other | Bad PGP | DoIt | OK |
|---|---|---|---|---|---|---|
| moderator@dana.de | 0 | 0 | 1 | 0 | 1 | 1 |
| TOTAL | 0 | 0 | 1 | 0 | 1 | 1 |
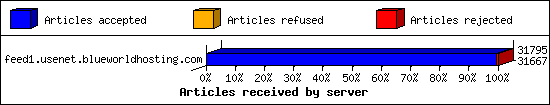
Incoming Feeds (INN):
| Server | Connects | Offered | Taken | Refused | Reject | %Accpt | Elapsed | |
|---|---|---|---|---|---|---|---|---|
| 1 | feed1.usenet.blueworldhosting.com | 7 | 31795 | 31667 | 0 | 128 | 99% | 13:15:03 |
| TOTAL: 1 | 7 | 31795 | 31667 | 0 | 128 | 99% | 13:15:03 | |
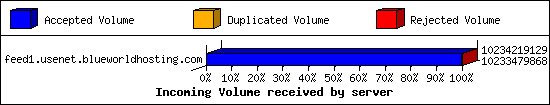
Incoming Volume (INN):
| Server | AcceptVol | DupVol | RejVol | TotalVol | %Acc | Vol/Art | |
|---|---|---|---|---|---|---|---|
| 1 | feed1.usenet.blueworldhosting.com | 9.5 GB | 0.0 KB | 721.9 KB | 9.5 GB | 99% | 314.3 KB |
| TOTAL: 1 | 9.5 GB | 0.0 KB | 721.9 KB | 9.5 GB | 99% | 314.3 KB | |
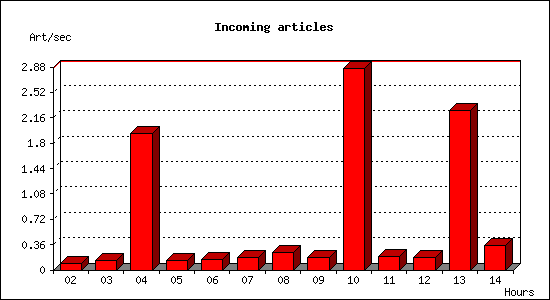
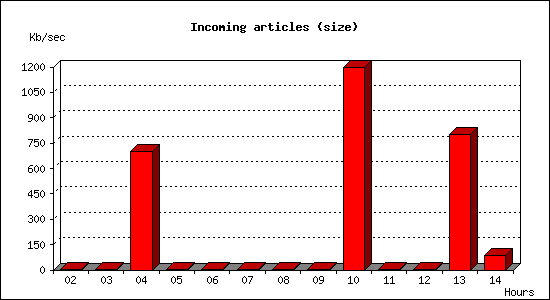
Incoming articles:
| Date | Articles | %Arts | Art/sec | Size | %Size | KB/sec |
|---|---|---|---|---|---|---|
| Jan 1 02:30:00 - 02:59:59 | 167 | 0.5% | 0.09 | 448.7 KB | 0.0% | 0.25 |
| Jan 1 03:00:00 - 03:59:59 | 480 | 1.5% | 0.13 | 7.9 MB | 0.1% | 2.23 |
| Jan 1 04:00:00 - 04:59:59 | 6973 | 22.0% | 1.94 | 2.4 GB | 25.2% | 699.45 |
| Jan 1 05:00:00 - 05:59:59 | 509 | 1.6% | 0.14 | 1.3 MB | 0.0% | 0.38 |
| Jan 1 06:00:00 - 06:59:59 | 515 | 1.6% | 0.14 | 3.1 MB | 0.0% | 0.89 |
| Jan 1 07:00:00 - 07:59:59 | 661 | 2.1% | 0.18 | 3.4 MB | 0.0% | 0.97 |
| Jan 1 08:00:00 - 08:59:59 | 878 | 2.8% | 0.24 | 17.9 MB | 0.2% | 5.08 |
| Jan 1 09:00:00 - 09:59:59 | 645 | 2.0% | 0.18 | 3.4 MB | 0.0% | 0.97 |
| Jan 1 10:00:00 - 10:59:59 | 10297 | 32.5% | 2.86 | 4.1 GB | 43.0% | 1194.15 |
| Jan 1 11:00:00 - 11:59:59 | 712 | 2.2% | 0.20 | 2.3 MB | 0.0% | 0.66 |
| Jan 1 12:00:00 - 12:59:59 | 632 | 2.0% | 0.18 | 2.0 MB | 0.0% | 0.57 |
| Jan 1 13:00:00 - 13:59:59 | 8148 | 25.7% | 2.26 | 2.7 GB | 28.8% | 800.76 |
| Jan 1 14:00:00 - 14:50:26 | 1052 | 3.3% | 0.35 | 246.6 MB | 2.5% | 83.46 |
| TOTAL: 12:20:26 | 31669 | 100.0% | 0.71 | 9.5 GB | 100.0% | 224.98 |
Sites sending bad articles:
| Server | Total | Group | Dist | Duplic | Unapp | TooOld | Site | Line | Other | |
|---|---|---|---|---|---|---|---|---|---|---|
| 1 | feed1.usenet.blueworldhosting.com | 321 | 100 | 0 | 0 | 0 | 0 | 0 | 0 | 221 |
| TOTAL: 1 | 321 | 100 | 0 | 0 | 0 | 0 | 0 | 0 | 221 | |
Unwanted newsgroups [Top 20]:
| Newsgroup | Count |
|---|---|
| finet.binaries.keskustelu | 40 |
| alt.binaries.pictures.scenic | 7 |
| alt.binaries.sounds.lossless.jazz | 4 |
| alt.binaries.pictures.purebeauty | 3 |
| alt.binaries.sounds.mp3.christmas | 3 |
| alt.binaries.test.yenc | 3 |
| alt.binaries.pictures.sierra | 3 |
| alt.binaries.pictures.rail | 3 |
| alt.binaries.drwho | 3 |
| alt.religion.buddhism | 2 |
| alt.binaries.sounds.lossless.1980s | 2 |
| alt.binaries.pictures.celebrities | 2 |
| alt.binaries.multimedia.erotica.amateur | 2 |
| alt.binaries.sounds.lossless.rock | 1 |
| alt.binaries.joker | 1 |
| alt.binaries.pictures.wallpaper | 1 |
| alt.binaries.erotica.collections.rars | 1 |
| alt.binaries.3d.poser | 1 |
| alt.binaries.gdead | 1 |
| alt.binaries.pictures.artpics | 1 |
| TOTAL: 36 | 100 |
INND Python filter [Top 20]:
| Reason | Count |
|---|---|
| EMP Body Reject | 15 |
| Bad From (FBInCIAnNSATerroristSlayer@yahoo.com) | 10 |
| Bad Subject (Solution manual ) | 2 |
| TOTAL: 3 | 27 |
Miscellaneous innd statistics [Top 10]:
| Event | Server | Number |
|---|---|---|
| Including strange strings | ||
| feed1.usenet.blueworldhosting.com | 194 | |
| TOTAL: 1 | 194 | |
| TOTAL: 1 | 194 | |
Outgoing Feeds (innfeed) by Articles:
| Server | Offered | Taken | Refused | Reject | Miss | Spool | %Took | Elapsed | |
|---|---|---|---|---|---|---|---|---|---|
| 1 | feed1.usenet.blueworldhosting.com | 0 | 0 | 0 | 0 | 0 | 0 | 0% | 00:10:00 |
| TOTAL: 1 | 0 | 0 | 0 | 0 | 0 | 0 | 0% | 00:10:00 | |
Outgoing Feeds (innfeed) by Volume:
| Server | AcceptVol | RejectVol | TotalVol | Volume/sec | Vol/Art | Elapsed | |
|---|---|---|---|---|---|---|---|
| 1 | feed1.usenet.blueworldhosting.com | 0.0 KB | 0.0 KB | 0.0 KB | 0.0 KB/s | 0 | 00:10:00 |
| TOTAL: 1 | 0.0 KB | 0.0 KB | 0.0 KB | 0.0 KB/s | 0 | 00:10:00 | |
NNRP readership statistics:
| System | Conn | Arts | Size | Groups | Post | Rej | Elapsed | |
|---|---|---|---|---|---|---|---|---|
| 1 | cpc116832-kemp8-2-0-cust473.9-2.cable.virginm.net | 12 | 0 | 0.0 KB | 0 | 0 | 0 | 00:00:16 |
| 2 | c-73-208-203-252.hsd1.il.comcast.net | 1 | 0 | 0.0 KB | 0 | 0 | 0 | 00:00:01 |
| 3 | 023-084-030-207.res.spectrum.com | 10 | 0 | 0.0 KB | 0 | 0 | 0 | 00:03:25 |
| 4 | toma-03.stehlik.co.uk | 481 | 0 | 0.0 KB | 0 | 0 | 0 | 13:06:47 |
| TOTAL: 4 | 504 | 0 | 0.0 KB | 0 | 0 | 0 | 13:10:31 | |
NNRP readership statistics (by domain):
| System | Conn | Arts | Size | Groups | Post | Rej | Elapsed | |
|---|---|---|---|---|---|---|---|---|
| 1 | *.res.spectrum.com | 10 | 0 | 0.0 KB | 0 | 0 | 0 | 00:03:25 |
| 2 | *.9-2.cable.virginm.net | 12 | 0 | 0.0 KB | 0 | 0 | 0 | 00:00:16 |
| 3 | *.stehlik.co.uk | 481 | 0 | 0.0 KB | 0 | 0 | 0 | 13:06:47 |
| 4 | *.hsd1.il.comcast.net | 1 | 0 | 0.0 KB | 0 | 0 | 0 | 00:00:01 |
| TOTAL: 4 | 504 | 0 | 0.0 KB | 0 | 0 | 0 | 13:10:31 | |
NNRP auth users [Top 20]:
| User | Conn |
|---|---|
| jesse | 10 |
| 0.066 system 0.008 idle 0.000 elapsed 0.074 | 1 |
| 0.070 system 0.008 idle 0.000 elapsed 0.077 | 1 |
| 0.074 system 0.008 idle 0.000 elapsed 0.082 | 1 |
| TOTAL: 4 | 13 |
NNRP total resource statistics [Top 20]:
| System | User(ms) | System(ms) | Idle(ms) | Elapsed |
|---|---|---|---|---|
| toma-03.stehlik.co.uk | 105.280 | 37.207 | 0.000 | 13:06:47 |
| 023-084-030-207.res.spectrum.com | 0.778 | 0.204 | 0.052 | 00:03:25 |
| cpc116832-kemp8-2-0-cust473.9-2.cable.virginm.net | 0.875 | 0.110 | 0.000 | 00:00:16 |
| c-73-208-203-252.hsd1.il.comcast.net | 0.075 | 0.014 | 0.000 | 00:00:01 |
| TOTAL: 4 | 107.008 | 37.535 | 0.052 | 13:10:31 |
NNRP client timeouts [Top 20]:
| System | Conn | Peer |
|---|---|---|
| 023-084-030-207.res.spectrum.com | 10 | 10 |
| toma-03.stehlik.co.uk | 4 | 3 |
| TOTAL: 2 | 14 | 13 |