Log entries by program:
| Program name | Lines | %Lines | Size | %Size |
|---|---|---|---|---|
| nnrpd | 46356 | 54.4% | 3.5 MB | 45.4% |
| inn | 37665 | 44.2% | 4.1 MB | 52.8% |
| innd | 1074 | 1.3% | 135.6 KB | 1.7% |
| innfeed | 127 | 0.1% | 10.2 KB | 0.1% |
| nocem | 1 | 0.0% | 0.1 KB | 0.0% |
| controlchan | 1 | 0.0% | 0.0 KB | 0.0% |
| TOTAL: 6 | 85224 | 100.0% | 7.7 MB | 100.0% |
History cache:
| Reason | Count | %Count |
|---|---|---|
| Do not exist | 37251 | 98.4% |
| Negative hits | 614 | 1.6% |
| Positive hits | 6 | 0.0% |
| Cache misses | 1 | 0.0% |
| TOTAL: 4 | 37872 | 100.0% |
INND timer:
| Code region | Time | Pct | Invoked | Min(ms) | Avg(ms) | Max(ms) |
|---|---|---|---|---|---|---|
| article cancel | 00:00:00.180 | 0.0% | 43 | 0.000 | 4.186 | 19.000 |
| article cleanup | 00:00:00.347 | 0.0% | 37292 | 0.000 | 0.009 | 0.044 |
| article logging | 00:00:00.637 | 0.0% | 37682 | 0.000 | 0.017 | 0.079 |
| article parse | 00:00:23.462 | 0.0% | 2167808 | 0.000 | 0.011 | 0.040 |
| article write | 00:06:06.756 | 0.5% | 36967 | 3.347 | 9.921 | 24.123 |
| artlog/artcncl | 00:00:00.000 | 0.0% | 7 | 0.000 | 0.000 | 0.000 |
| data move | 00:00:02.466 | 0.0% | 2385122 | 0.000 | 0.001 | 0.051 |
| hisgrep/artcncl | 00:00:00.029 | 0.0% | 50 | 0.000 | 0.580 | 8.000 |
| hishave/artcncl | 00:00:00.000 | 0.0% | 7 | 0.000 | 0.000 | 0.000 |
| history grep | 00:00:00.000 | 0.0% | 0 | 0.000 | 0.000 | 0.000 |
| history lookup | 00:00:15.933 | 0.0% | 37906 | 0.073 | 0.420 | 6.203 |
| history sync | 00:00:01.800 | 0.0% | 279 | 1.800 | 6.452 | 10.500 |
| history write | 00:00:51.877 | 0.1% | 37292 | 0.795 | 1.391 | 2.427 |
| idle | 18:40:52.010 | 98.3% | 2162665 | 1.087 | 31.097 | 9089.273 |
| nntp read | 00:01:35.494 | 0.1% | 2162649 | 0.000 | 0.044 | 0.094 |
| overview write | 00:00:10.538 | 0.0% | 36967 | 0.111 | 0.285 | 3.333 |
| perl filter | 00:00:03.472 | 0.0% | 37107 | 0.000 | 0.094 | 0.159 |
| python filter | 00:09:51.986 | 0.9% | 37292 | 0.642 | 15.874 | 26.410 |
| site send | 00:00:01.103 | 0.0% | 37027 | 0.000 | 0.030 | 0.087 |
| TOTAL: 19:00:31.818 | 19:00:18.090 | 100.0% | - | - | - | - |
INNfeed timer:
| Code region | Time | Pct | Invoked | Min(ms) | Avg(ms) | Max(ms) |
|---|---|---|---|---|---|---|
| article new | 00:00:00.000 | 0.0% | 0 | 0.000 | 0.000 | 0.000 |
| article prepare | 00:00:00.000 | 0.0% | 0 | 0.000 | 0.000 | 0.000 |
| article read | 00:00:00.000 | 0.0% | 0 | 0.000 | 0.000 | 0.000 |
| backlog stats | 00:00:00.001 | 0.0% | 2948 | 0.000 | 0.000 | 0.038 |
| callbacks | 00:00:00.000 | 0.0% | 0 | 0.000 | 0.000 | 0.000 |
| data read | 00:00:00.000 | 0.0% | 3 | 0.000 | 0.000 | 0.000 |
| data write | 00:00:00.000 | 0.0% | 3 | 0.000 | 0.000 | 0.000 |
| idle | 18:54:39.374 | 100.0% | 2948 | 17411.857 | 23093.410 | 24146.440 |
| status file | 00:00:00.000 | 0.0% | 6 | 0.000 | 0.000 | 0.000 |
| TOTAL: 18:54:39.426 | 18:54:39.375 | 100.0% | - | - | - | - |
nnrpd timer:
| Code region | Time | Pct | Invoked | Min(ms) | Avg(ms) | Max(ms) |
|---|---|---|---|---|---|---|
| hisgrep | 00:00:00.000 | 0.0% | 4 | 0.000 | 0.000 | 0.000 |
| idle | 00:00:00.000 | 0.0% | 0 | 0.000 | 0.000 | 0.000 |
| newnews | 00:00:00.000 | 0.0% | 0 | 0.000 | 0.000 | 0.000 |
| nntpwrite | 00:23:37.913 | 1.9% | 11426755 | 0.000 | 0.124 | 101.857 |
| readart | 00:00:00.100 | 0.0% | 5 | 16.500 | 20.000 | 33.000 |
| TOTAL: 20:57:02.004 | 00:23:38.013 | 1.9% | - | - | - | - |
Control commands to INND:
| Command | Number |
|---|---|
| flush | 5 |
| flushlogs | 2 |
| go | 1 |
| logmode | 2 |
| mode | 119 |
| name | 2 |
| pause | 1 |
| paused | 1 |
| renumber | 1 |
| TOTAL: 9 | 134 |
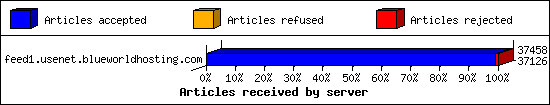
Incoming Feeds (INN):
| Server | Connects | Offered | Taken | Refused | Reject | %Accpt | Elapsed | |
|---|---|---|---|---|---|---|---|---|
| 1 | feed1.usenet.blueworldhosting.com | 10 | 37458 | 37126 | 0 | 332 | 99% | 20:04:54 |
| TOTAL: 1 | 10 | 37458 | 37126 | 0 | 332 | 99% | 20:04:54 | |
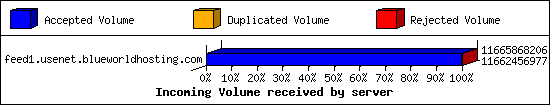
Incoming Volume (INN):
| Server | AcceptVol | DupVol | RejVol | TotalVol | %Acc | Vol/Art | |
|---|---|---|---|---|---|---|---|
| 1 | feed1.usenet.blueworldhosting.com | 10.9 GB | 0.0 KB | 3.3 MB | 10.9 GB | 99% | 304.1 KB |
| TOTAL: 1 | 10.9 GB | 0.0 KB | 3.3 MB | 10.9 GB | 99% | 304.1 KB | |
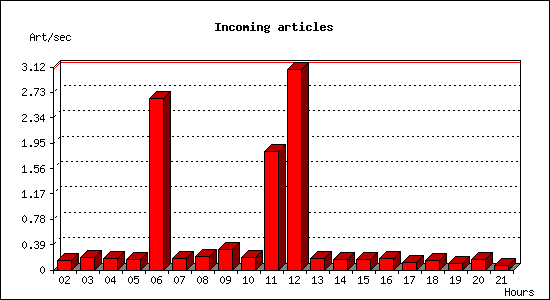
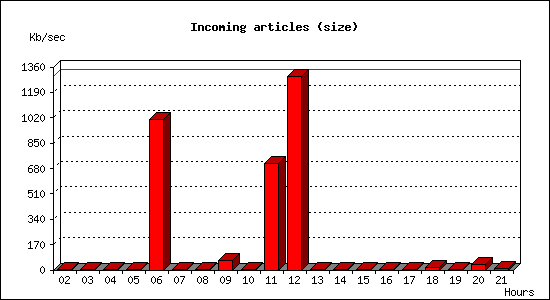
Incoming articles:
| Date | Articles | %Arts | Art/sec | Size | %Size | KB/sec |
|---|---|---|---|---|---|---|
| Jan 5 02:30:00 - 02:59:59 | 273 | 0.7% | 0.15 | 768.3 KB | 0.0% | 0.43 |
| Jan 5 03:00:00 - 03:59:59 | 693 | 1.9% | 0.19 | 2.4 MB | 0.0% | 0.68 |
| Jan 5 04:00:00 - 04:59:59 | 647 | 1.8% | 0.18 | 1.9 MB | 0.0% | 0.53 |
| Jan 5 05:00:00 - 05:59:59 | 582 | 1.6% | 0.16 | 1.5 MB | 0.0% | 0.42 |
| Jan 5 06:00:00 - 06:59:59 | 9480 | 25.7% | 2.63 | 3.5 GB | 32.0% | 1009.32 |
| Jan 5 07:00:00 - 07:59:59 | 616 | 1.7% | 0.17 | 2.5 MB | 0.0% | 0.72 |
| Jan 5 08:00:00 - 08:59:59 | 754 | 2.0% | 0.21 | 3.5 MB | 0.0% | 1.01 |
| Jan 5 09:00:00 - 09:59:59 | 1123 | 3.0% | 0.31 | 228.3 MB | 2.1% | 64.92 |
| Jan 5 10:00:00 - 10:59:59 | 699 | 1.9% | 0.19 | 2.2 MB | 0.0% | 0.63 |
| Jan 5 11:00:00 - 11:59:59 | 6531 | 17.7% | 1.81 | 2.4 GB | 22.6% | 712.41 |
| Jan 5 12:00:00 - 12:59:59 | 11101 | 30.1% | 3.08 | 4.5 GB | 41.1% | 1296.64 |
| Jan 5 13:00:00 - 13:59:59 | 636 | 1.7% | 0.18 | 2.4 MB | 0.0% | 0.69 |
| Jan 5 14:00:00 - 14:59:59 | 580 | 1.6% | 0.16 | 2.4 MB | 0.0% | 0.67 |
| Jan 5 15:00:00 - 15:59:59 | 598 | 1.6% | 0.17 | 9.2 MB | 0.1% | 2.61 |
| Jan 5 16:00:00 - 16:59:59 | 626 | 1.7% | 0.17 | 6.7 MB | 0.1% | 1.92 |
| Jan 5 17:00:00 - 17:59:59 | 439 | 1.2% | 0.12 | 2.6 MB | 0.0% | 0.74 |
| Jan 5 18:00:00 - 18:59:59 | 523 | 1.4% | 0.15 | 65.6 MB | 0.6% | 18.66 |
| Jan 5 19:00:00 - 19:59:59 | 333 | 0.9% | 0.09 | 2.8 MB | 0.0% | 0.78 |
| Jan 5 20:00:00 - 20:59:59 | 565 | 1.5% | 0.16 | 122.2 MB | 1.1% | 34.76 |
| Jan 5 21:00:00 - 21:30:00 | 136 | 0.4% | 0.08 | 17.7 MB | 0.2% | 10.06 |
| TOTAL: 19:00:00 | 36935 | 100.0% | 0.54 | 10.8 GB | 100.0% | 165.97 |
Sites sending bad articles:
| Server | Total | Group | Dist | Duplic | Unapp | TooOld | Site | Line | Other | |
|---|---|---|---|---|---|---|---|---|---|---|
| 1 | feed1.usenet.blueworldhosting.com | 723 | 139 | 0 | 0 | 0 | 0 | 0 | 0 | 584 |
| TOTAL: 1 | 723 | 139 | 0 | 0 | 0 | 0 | 0 | 0 | 584 | |
Unwanted newsgroups [Top 20]:
| Newsgroup | Count |
|---|---|
| finet.binaries.keskustelu | 36 |
| alt.binaries.nospam.female.bodyhair.pubes | 10 |
| alt.binaries.pictures.scenic | 9 |
| alt.binaries.sounds.karaoke | 6 |
| alt.binaries.nospam.female.bodyhair | 5 |
| alt.binaries.pictures.earlmiller | 4 |
| alt.binaries.test.yenc | 4 |
| alt.religion.buddhism | 3 |
| grc.techtalk.linux | 3 |
| alt.alt.alt.alt | 3 |
| alt.binaries.sounds.lossless | 3 |
| de.org.politik.misc | 3 |
| alt.binaries.classic.tv.shows | 2 |
| alt.binaries.pictures.vehicles | 2 |
| fr.petites-annonces.informatique.materiel | 2 |
| alt.binaries.3d.poser | 2 |
| alt.binaries.erotica.divx | 2 |
| panix.test | 2 |
| alt.binaries.pictures.sierra | 2 |
| alt.binaries.boneless | 2 |
| TOTAL: 50 | 139 |
INND Python filter [Top 20]:
| Reason | Count |
|---|---|
| EMP Body Reject | 112 |
| Bad Subject (Solution manual ) | 24 |
| Bad Subject (Solution Manual ) | 17 |
| Bad From (FBInCIAnNSATerroristSlayer@yahoo.com) | 15 |
| Bad From (hclaudioblanco@gmail.com) | 14 |
| Bad Subject (Buy Cocaine) | 6 |
| Bad Subject (Buy Hydrocodone) | 1 |
| Bad Subject (Codeine Online) | 1 |
| Bad Subject (Buy Xanax) | 1 |
| Bad Subject (Buy Adderall) | 1 |
| TOTAL: 10 | 192 |
Miscellaneous innd statistics [Top 10]:
| Event | Server | Number |
|---|---|---|
| Including strange strings | ||
| feed1.usenet.blueworldhosting.com | 392 | |
| TOTAL: 1 | 392 | |
| TOTAL: 1 | 392 | |
Outgoing Feeds (innfeed) by Articles:
| Server | Offered | Taken | Refused | Reject | Miss | Spool | %Took | Elapsed | |
|---|---|---|---|---|---|---|---|---|---|
| 1 | feed1.usenet.blueworldhosting.com | 0 | 0 | 0 | 0 | 0 | 0 | 0% | 00:10:00 |
| TOTAL: 1 | 0 | 0 | 0 | 0 | 0 | 0 | 0% | 00:10:00 | |
Outgoing Feeds (innfeed) by Volume:
| Server | AcceptVol | RejectVol | TotalVol | Volume/sec | Vol/Art | Elapsed | |
|---|---|---|---|---|---|---|---|
| 1 | feed1.usenet.blueworldhosting.com | 0.0 KB | 0.0 KB | 0.0 KB | 0.0 KB/s | 0 | 00:10:00 |
| TOTAL: 1 | 0.0 KB | 0.0 KB | 0.0 KB | 0.0 KB/s | 0 | 00:10:00 | |
NNRP readership statistics:
| System | Conn | Arts | Size | Groups | Post | Rej | Elapsed | |
|---|---|---|---|---|---|---|---|---|
| 1 | 023-084-030-207.res.spectrum.com | 322 | 5 | 10.6 KB | 2 | 0 | 0 | 03:04:33 |
| TOTAL: 1 | 322 | 5 | 10.6 KB | 2 | 0 | 0 | 20:56:56 | |
NNRP readership statistics (by domain):
| System | Conn | Arts | Size | Groups | Post | Rej | Elapsed | |
|---|---|---|---|---|---|---|---|---|
| 1 | *.res.spectrum.com | 322 | 5 | 10.6 KB | 2 | 0 | 0 | 03:04:33 |
| 2 | *.stehlik.co.uk | 725 | 0 | 0.0 KB | 0 | 0 | 0 | 17:52:20 |
| 3 | *.hsd1.il.comcast.net | 1 | 0 | 0.0 KB | 0 | 0 | 0 | 00:00:02 |
| TOTAL: 3 | 1048 | 5 | 10.6 KB | 2 | 0 | 0 | 20:56:56 | |
NNRP auth users [Top 20]:
| User | Conn |
|---|---|
| jesse | 322 |
| TOTAL: 1 | 322 |
NNRP total resource statistics [Top 20]:
| System | User(ms) | System(ms) | Idle(ms) | Elapsed |
|---|---|---|---|---|
| toma-03.stehlik.co.uk | 147.190 | 49.294 | 0.000 | 17:52:20 |
| 023-084-030-207.res.spectrum.com | 23.907 | 3.469 | 1.713 | 03:04:33 |
| c-73-208-203-252.hsd1.il.comcast.net | 0.089 | 0.000 | 0.000 | 00:00:02 |
| TOTAL: 3 | 171.186 | 52.763 | 1.713 | 20:56:56 |
Curious NNRP server explorers [Top 20]:
| System | Conn |
|---|---|
| toma-03.stehlik.co.uk | 725 |
| c-73-208-203-252.hsd1.il.comcast.net | 1 |
| TOTAL: 2 | 726 |
NNRP client timeouts [Top 20]:
| System | Conn | Peer |
|---|---|---|
| 023-084-030-207.res.spectrum.com | 322 | 322 |
| toma-03.stehlik.co.uk | 2 | 2 |
| TOTAL: 2 | 324 | 324 |
Newsgroup request counts (by hierarchy):
| Hierarchy | Count | Pct | |
|---|---|---|---|
| 1 | alt | 3 | 100.0% |
| TOTAL: 1 | 3 | 100.0% | |
Newsgroup request counts (by newsgroup) [Top 100]:
| Newsgroup | Count | |
|---|---|---|
| 1 | alt.binaries.multimedia.documentaries | 3 |
| TOTAL: 1 | 3 | |