Log entries by program:
| Program name | Lines | %Lines | Size | %Size |
|---|---|---|---|---|
| nnrpd | 59634 | 53.6% | 4.5 MB | 43.9% |
| inn | 50355 | 45.2% | 5.6 MB | 54.5% |
| innd | 1146 | 1.0% | 153.3 KB | 1.5% |
| innfeed | 160 | 0.1% | 13.0 KB | 0.1% |
| innxmit | 4 | 0.0% | 0.5 KB | 0.0% |
| controlchan | 1 | 0.0% | 0.1 KB | 0.0% |
| nocem | 1 | 0.0% | 0.1 KB | 0.0% |
| TOTAL: 7 | 111301 | 100.0% | 10.2 MB | 100.0% |
History cache:
| Reason | Count | %Count |
|---|---|---|
| Do not exist | 49903 | 97.7% |
| Negative hits | 1142 | 2.2% |
| Positive hits | 24 | 0.0% |
| Cache misses | 4 | 0.0% |
| TOTAL: 4 | 51073 | 100.0% |
INND timer:
| Code region | Time | Pct | Invoked | Min(ms) | Avg(ms) | Max(ms) |
|---|---|---|---|---|---|---|
| article cancel | 00:00:00.452 | 0.0% | 68 | 0.000 | 6.647 | 18.000 |
| article cleanup | 00:00:00.438 | 0.0% | 49971 | 0.000 | 0.009 | 0.042 |
| article logging | 00:00:00.993 | 0.0% | 50346 | 0.000 | 0.020 | 0.103 |
| article parse | 00:00:34.284 | 0.0% | 2651427 | 0.000 | 0.013 | 0.125 |
| article write | 00:09:24.628 | 0.7% | 49683 | 0.203 | 11.365 | 23.382 |
| artlog/artcncl | 00:00:00.000 | 0.0% | 15 | 0.000 | 0.000 | 0.000 |
| data move | 00:00:04.468 | 0.0% | 2956951 | 0.000 | 0.002 | 0.012 |
| hisgrep/artcncl | 00:00:00.054 | 0.0% | 83 | 0.000 | 0.651 | 4.444 |
| hishave/artcncl | 00:00:00.000 | 0.0% | 15 | 0.000 | 0.000 | 0.000 |
| history grep | 00:00:00.000 | 0.0% | 0 | 0.000 | 0.000 | 0.000 |
| history lookup | 00:00:12.902 | 0.0% | 51126 | 0.000 | 0.252 | 10.011 |
| history sync | 00:00:02.424 | 0.0% | 397 | 0.000 | 6.106 | 48.000 |
| history write | 00:00:53.309 | 0.1% | 49971 | 0.000 | 1.067 | 6.330 |
| idle | 22:47:19.385 | 94.5% | 2641728 | 2.265 | 31.055 | 14648.195 |
| nntp read | 00:03:08.967 | 0.2% | 2641543 | 0.000 | 0.072 | 0.197 |
| overview write | 00:51:08.333 | 3.5% | 49683 | 0.170 | 61.758 | 175881.750 |
| perl filter | 00:00:05.475 | 0.0% | 49897 | 0.000 | 0.110 | 0.250 |
| python filter | 00:13:38.598 | 0.9% | 49971 | 0.653 | 16.381 | 23.801 |
| site send | 00:00:01.963 | 0.0% | 49740 | 0.000 | 0.039 | 0.273 |
| TOTAL: 24:07:04.930 | 24:06:36.673 | 100.0% | - | - | - | - |
INNfeed timer:
| Code region | Time | Pct | Invoked | Min(ms) | Avg(ms) | Max(ms) |
|---|---|---|---|---|---|---|
| article new | 00:00:00.000 | 0.0% | 0 | 0.000 | 0.000 | 0.000 |
| article prepare | 00:00:00.000 | 0.0% | 0 | 0.000 | 0.000 | 0.000 |
| article read | 00:00:00.000 | 0.0% | 0 | 0.000 | 0.000 | 0.000 |
| backlog stats | 00:00:00.000 | 0.0% | 3732 | 0.000 | 0.000 | 0.000 |
| callbacks | 00:00:00.000 | 0.0% | 0 | 0.000 | 0.000 | 0.000 |
| data read | 00:00:00.000 | 0.0% | 3 | 0.000 | 0.000 | 0.000 |
| data write | 00:00:00.001 | 0.0% | 3 | 0.333 | 0.333 | 0.333 |
| idle | 23:55:33.404 | 100.0% | 3732 | 16097.846 | 23079.690 | 25053.458 |
| status file | 00:00:00.001 | 0.0% | 6 | 0.167 | 0.167 | 0.167 |
| TOTAL: 23:55:33.456 | 23:55:33.406 | 100.0% | - | - | - | - |
nnrpd timer:
| Code region | Time | Pct | Invoked | Min(ms) | Avg(ms) | Max(ms) |
|---|---|---|---|---|---|---|
| idle | 00:00:00.000 | 0.0% | 0 | 0.000 | 0.000 | 0.000 |
| newnews | 00:00:00.000 | 0.0% | 0 | 0.000 | 0.000 | 0.000 |
| nntpwrite | 00:32:09.792 | 2.2% | 15361558 | 0.000 | 0.126 | 0.288 |
| TOTAL: 23:51:04.188 | 00:32:09.792 | 2.2% | - | - | - | - |
Control commands to INND:
| Command | Number |
|---|---|
| flush | 5 |
| flushlogs | 2 |
| go | 2 |
| logmode | 2 |
| lowmark | 1 |
| mode | 40 |
| name | 2 |
| pause | 2 |
| paused | 2 |
| reload | 2 |
| reserve | 2 |
| TOTAL: 11 | 62 |
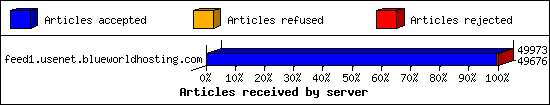
Incoming Feeds (INN):
| Server | Connects | Offered | Taken | Refused | Reject | %Accpt | Elapsed | |
|---|---|---|---|---|---|---|---|---|
| 1 | feed1.usenet.blueworldhosting.com | 23 | 49973 | 49676 | 13 | 284 | 99% | 25:55:48 |
| TOTAL: 1 | 23 | 49973 | 49676 | 13 | 284 | 99% | 25:55:48 | |
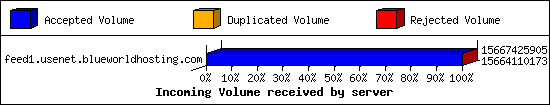
Incoming Volume (INN):
| Server | AcceptVol | DupVol | RejVol | TotalVol | %Acc | Vol/Art | |
|---|---|---|---|---|---|---|---|
| 1 | feed1.usenet.blueworldhosting.com | 14.6 GB | 0.0 KB | 3.2 MB | 14.6 GB | 99% | 306.2 KB |
| TOTAL: 1 | 14.6 GB | 0.0 KB | 3.2 MB | 14.6 GB | 99% | 306.2 KB | |
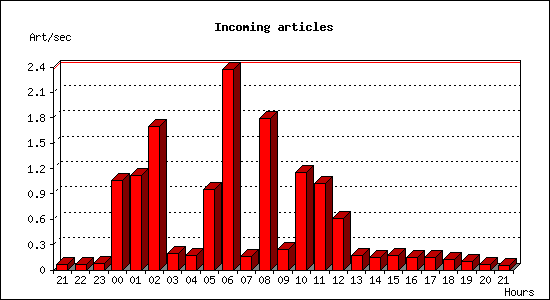
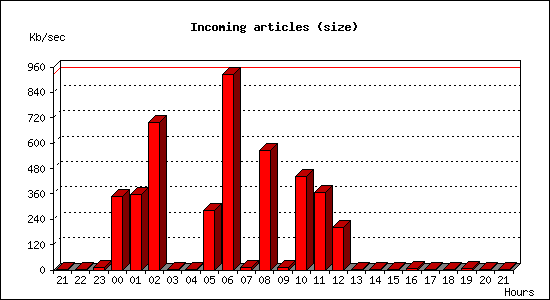
Incoming articles:
| Date | Articles | %Arts | Art/sec | Size | %Size | KB/sec |
|---|---|---|---|---|---|---|
| Jan 6 21:30:00 - 21:59:59 | 120 | 0.2% | 0.07 | 1.1 MB | 0.0% | 0.62 |
| Jan 6 22:00:00 - 22:59:59 | 221 | 0.4% | 0.06 | 749.1 KB | 0.0% | 0.21 |
| Jan 6 23:00:00 - 23:59:59 | 275 | 0.6% | 0.08 | 35.6 MB | 0.2% | 10.11 |
| Jan 7 00:00:00 - 00:59:59 | 3797 | 7.6% | 1.05 | 1.2 GB | 8.2% | 346.60 |
| Jan 7 01:00:00 - 01:59:59 | 4017 | 8.1% | 1.12 | 1.2 GB | 8.4% | 357.55 |
| Jan 7 02:00:00 - 02:59:59 | 6121 | 12.3% | 1.70 | 2.4 GB | 16.4% | 698.79 |
| Jan 7 03:00:00 - 03:59:59 | 686 | 1.4% | 0.19 | 2.2 MB | 0.0% | 0.61 |
| Jan 7 04:00:00 - 04:59:59 | 619 | 1.2% | 0.17 | 2.0 MB | 0.0% | 0.55 |
| Jan 7 05:00:00 - 05:59:59 | 3446 | 6.9% | 0.96 | 997.2 MB | 6.7% | 283.64 |
| Jan 7 06:00:00 - 06:59:59 | 8537 | 17.2% | 2.37 | 3.2 GB | 21.8% | 925.49 |
| Jan 7 07:00:00 - 07:59:59 | 571 | 1.1% | 0.16 | 42.9 MB | 0.3% | 12.20 |
| Jan 7 08:00:00 - 08:59:59 | 6431 | 12.9% | 1.79 | 1.9 GB | 13.3% | 563.47 |
| Jan 7 09:00:00 - 09:59:59 | 878 | 1.8% | 0.24 | 48.5 MB | 0.3% | 13.81 |
| Jan 7 10:00:00 - 10:59:59 | 4170 | 8.4% | 1.16 | 1.5 GB | 10.4% | 440.66 |
| Jan 7 11:00:00 - 11:59:59 | 3666 | 7.4% | 1.02 | 1.3 GB | 8.6% | 367.50 |
| Jan 7 12:00:00 - 12:59:59 | 2187 | 4.4% | 0.61 | 713.9 MB | 4.8% | 203.05 |
| Jan 7 13:00:00 - 13:59:59 | 623 | 1.3% | 0.17 | 3.5 MB | 0.0% | 0.99 |
| Jan 7 14:00:00 - 14:59:59 | 533 | 1.1% | 0.15 | 1.5 MB | 0.0% | 0.41 |
| Jan 7 15:00:00 - 15:59:59 | 606 | 1.2% | 0.17 | 2.6 MB | 0.0% | 0.74 |
| Jan 7 16:00:00 - 16:59:59 | 530 | 1.1% | 0.15 | 29.6 MB | 0.2% | 8.43 |
| Jan 7 17:00:00 - 17:59:59 | 531 | 1.1% | 0.15 | 1.8 MB | 0.0% | 0.51 |
| Jan 7 18:00:00 - 18:59:59 | 455 | 0.9% | 0.13 | 3.6 MB | 0.0% | 1.01 |
| Jan 7 19:00:00 - 19:59:59 | 355 | 0.7% | 0.10 | 27.7 MB | 0.2% | 7.86 |
| Jan 7 20:00:00 - 20:59:59 | 213 | 0.4% | 0.06 | 16.0 MB | 0.1% | 4.55 |
| Jan 7 21:00:00 - 21:30:00 | 89 | 0.2% | 0.05 | 357.9 KB | 0.0% | 0.20 |
| TOTAL: 24:00:00 | 49677 | 100.0% | 0.57 | 14.6 GB | 100.0% | 177.05 |
Sites sending bad articles:
| Server | Total | Group | Dist | Duplic | Unapp | TooOld | Site | Line | Other | |
|---|---|---|---|---|---|---|---|---|---|---|
| 1 | feed1.usenet.blueworldhosting.com | 663 | 213 | 0 | 0 | 1 | 0 | 0 | 0 | 449 |
| TOTAL: 1 | 663 | 213 | 0 | 0 | 1 | 0 | 0 | 0 | 449 | |
Unwanted newsgroups [Top 20]:
| Newsgroup | Count |
|---|---|
| finet.binaries.keskustelu | 32 |
| alt.binaries.pictures.wallpaper | 25 |
| alt.binaries.pictures.rail | 16 |
| alt.binaries.nospam.female.bodyhair | 15 |
| alt.binaries.pictures.earlmiller | 12 |
| alt.binaries.pictures.scenic | 11 |
| alt.binaries.multimedia.cooking | 9 |
| alt.binaries.test.yenc | 8 |
| alt.religion.buddhism | 7 |
| alt.binaries.sounds.lossless.blues | 7 |
| alt.binaries.pictures.teen-starlets | 6 |
| alt.binaries.images.fun | 5 |
| alt.binaries.boneless | 4 |
| alt.binaries.sounds.radio.bbc | 4 |
| hccnet.koffiepraat | 2 |
| alt.binaries.sounds.karaoke | 2 |
| alt.binaries.full.post.verified.playboy | 2 |
| alt.binaries.startrek.adult | 2 |
| alt.binaries.mp3.audiobooks | 2 |
| alt.binaries.pictures.aviation | 2 |
| TOTAL: 53 | 213 |
Supposedly-moderated groups with unmoderated postings [Top 20]:
| Groups | Count |
|---|---|
| bit.listserv.catholic | 1 |
| TOTAL: 1 | 1 |
INND Python filter [Top 20]:
| Reason | Count |
|---|---|
| Bad Subject (Solution Manual ) | 25 |
| EMP Body Reject | 15 |
| Bad Subject (Solution manual ) | 13 |
| Bad From (FBInCIAnNSATerroristSlayer@yahoo.com) | 12 |
| Bad Subject (Buy Adderall) | 5 |
| Bad Subject (buy cocaine online) | 2 |
| Bad Subject (Buy adderall) | 1 |
| Bad Subject (Buy Hydrocodone) | 1 |
| TOTAL: 8 | 74 |
Miscellaneous innd statistics [Top 10]:
| Event | Server | Number |
|---|---|---|
| Including strange strings | ||
| feed1.usenet.blueworldhosting.com | 375 | |
| TOTAL: 1 | 375 | |
| TOTAL: 1 | 375 | |
Outgoing Feeds (innfeed) by Articles:
| Server | Offered | Taken | Refused | Reject | Miss | Spool | %Took | Elapsed | |
|---|---|---|---|---|---|---|---|---|---|
| 1 | feed1.usenet.blueworldhosting.com | 0 | 0 | 0 | 0 | 0 | 0 | 0% | 00:10:00 |
| TOTAL: 1 | 0 | 0 | 0 | 0 | 0 | 0 | 0% | 00:10:00 | |
Outgoing Feeds (innfeed) by Volume:
| Server | AcceptVol | RejectVol | TotalVol | Volume/sec | Vol/Art | Elapsed | |
|---|---|---|---|---|---|---|---|
| 1 | feed1.usenet.blueworldhosting.com | 0.0 KB | 0.0 KB | 0.0 KB | 0.0 KB/s | 0 | 00:10:00 |
| TOTAL: 1 | 0.0 KB | 0.0 KB | 0.0 KB | 0.0 KB/s | 0 | 00:10:00 | |
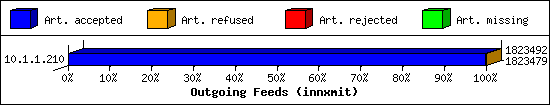
Outgoing Feeds (innxmit) by Articles:
| Server | Offered | Taken | Refused | Reject | Miss | %Acc | Elapsed | |
|---|---|---|---|---|---|---|---|---|
| 1 | 10.1.1.210 | 1823494 | 1823479 | 13 | 0 | 0 | 99% | 05:05:51 |
| TOTAL: 1 | 1823494 | 1823479 | 13 | 0 | 0 | 99% | 05:05:51 | |
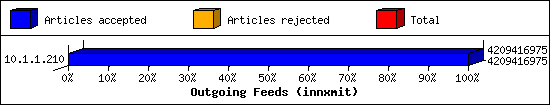
Outgoing Feeds (innxmit) by Volume:
| Server | AcceptVol | RejectVol | TotalVol | KB/s | Vol/Art | Elapsed | |
|---|---|---|---|---|---|---|---|
| 1 | 10.1.1.210 | 3.9 GB | 0.0 KB | 3.9 GB | 224.0 | 2.3 KB | 05:05:51 |
| TOTAL: 1 | 3.9 GB | 0.0 KB | 3.9 GB | 224.0 | 2.3 KB | 05:05:51 | |
Outgoing Feeds (innxmit) - other information:
| Server | Conn | Ok | Auth | Load | Space | Expire | Connct | Other | Pct | |
|---|---|---|---|---|---|---|---|---|---|---|
| 1 | 10.1.1.210 | 2 | 2 | 0 | 0 | 0 | 0 | 0 | 0 | 100% |
| TOTAL: 1 | 2 | 2 | 0 | 0 | 0 | 0 | 0 | 0 | 100% | |
NNRP readership statistics:
| System | Conn | Arts | Size | Groups | Post | Rej | Elapsed | |
|---|---|---|---|---|---|---|---|---|
| 1 | 94.102.61.39 | 1 | 0 | 0.0 KB | 0 | 0 | 0 | 00:00:00 |
| 2 | toma-03.stehlik.co.uk | 1181 | 0 | 0.0 KB | 0 | 0 | 0 | 23:50:57 |
| TOTAL: 2 | 1182 | 0 | 0.0 KB | 0 | 0 | 0 | 23:50:57 | |
NNRP readership statistics (by domain):
| System | Conn | Arts | Size | Groups | Post | Rej | Elapsed | |
|---|---|---|---|---|---|---|---|---|
| 1 | unresolved | 1 | 0 | 0.0 KB | 0 | 0 | 0 | 00:00:00 |
| 2 | *.stehlik.co.uk | 1181 | 0 | 0.0 KB | 0 | 0 | 0 | 23:50:57 |
| TOTAL: 2 | 1182 | 0 | 0.0 KB | 0 | 0 | 0 | 23:50:57 | |
NNRP total resource statistics [Top 20]:
| System | User(ms) | System(ms) | Idle(ms) | Elapsed |
|---|---|---|---|---|
| toma-03.stehlik.co.uk | 229.171 | 88.305 | 0.000 | 23:50:57 |
| 94.102.61.39 | 0.066 | 0.022 | 0.000 | 00:00:00 |
| TOTAL: 2 | 229.237 | 88.327 | 0.000 | 23:50:57 |
NNRP client timeouts [Top 20]:
| System | Conn | Peer |
|---|---|---|
| toma-03.stehlik.co.uk | 8 | 9 |
| TOTAL: 1 | 8 | 9 |