Log entries by program:
| Program name | Lines | %Lines | Size | %Size |
|---|---|---|---|---|
| nnrpd | 78162 | 76.6% | 5.7 MB | 68.1% |
| inn | 22684 | 22.2% | 2.5 MB | 30.0% |
| innd | 1024 | 1.0% | 144.9 KB | 1.7% |
| innfeed | 159 | 0.2% | 12.5 KB | 0.1% |
| controlchan | 1 | 0.0% | 0.1 KB | 0.0% |
| nocem | 1 | 0.0% | 0.1 KB | 0.0% |
| TOTAL: 6 | 102031 | 100.0% | 8.4 MB | 100.0% |
History cache:
| Reason | Count | %Count |
|---|---|---|
| Do not exist | 22248 | 91.4% |
| Negative hits | 2078 | 8.5% |
| Positive hits | 5 | 0.0% |
| Cache misses | 0 | 0.0% |
| TOTAL: 4 | 24331 | 100.0% |
INND timer:
| Code region | Time | Pct | Invoked | Min(ms) | Avg(ms) | Max(ms) |
|---|---|---|---|---|---|---|
| article cancel | 00:00:00.090 | 0.0% | 39 | 0.000 | 2.308 | 8.000 |
| article cleanup | 00:00:00.211 | 0.0% | 22320 | 0.000 | 0.009 | 0.094 |
| article logging | 00:00:00.379 | 0.0% | 22677 | 0.000 | 0.017 | 0.062 |
| article parse | 00:00:07.711 | 0.0% | 676710 | 0.000 | 0.011 | 0.061 |
| article write | 00:01:49.969 | 0.1% | 20945 | 0.158 | 5.250 | 15.816 |
| artlog/artcncl | 00:00:00.000 | 0.0% | 5 | 0.000 | 0.000 | 0.000 |
| data move | 00:00:00.894 | 0.0% | 748715 | 0.000 | 0.001 | 0.018 |
| hisgrep/artcncl | 00:00:00.010 | 0.0% | 44 | 0.000 | 0.227 | 0.571 |
| hishave/artcncl | 00:00:00.000 | 0.0% | 5 | 0.000 | 0.000 | 0.000 |
| history grep | 00:00:00.000 | 0.0% | 0 | 0.000 | 0.000 | 0.000 |
| history lookup | 00:00:05.522 | 0.0% | 24398 | 0.083 | 0.226 | 0.755 |
| history sync | 00:00:02.641 | 0.0% | 411 | 0.000 | 6.426 | 11.000 |
| history write | 00:00:19.029 | 0.0% | 22320 | 0.510 | 0.853 | 1.349 |
| idle | 23:54:42.651 | 99.5% | 678095 | 3.227 | 126.948 | 9530.032 |
| nntp read | 00:00:31.099 | 0.0% | 677797 | 0.000 | 0.046 | 0.088 |
| overview write | 00:00:13.037 | 0.0% | 20945 | 0.106 | 0.622 | 7.231 |
| perl filter | 00:00:01.652 | 0.0% | 22253 | 0.000 | 0.074 | 0.173 |
| python filter | 00:03:14.256 | 0.2% | 22320 | 0.734 | 8.703 | 27.766 |
| site send | 00:00:00.621 | 0.0% | 21022 | 0.000 | 0.030 | 0.132 |
| TOTAL: 24:01:17.575 | 24:01:09.772 | 100.0% | - | - | - | - |
INNfeed timer:
| Code region | Time | Pct | Invoked | Min(ms) | Avg(ms) | Max(ms) |
|---|---|---|---|---|---|---|
| article new | 00:00:00.000 | 0.0% | 0 | 0.000 | 0.000 | 0.000 |
| article prepare | 00:00:00.000 | 0.0% | 0 | 0.000 | 0.000 | 0.000 |
| article read | 00:00:00.000 | 0.0% | 0 | 0.000 | 0.000 | 0.000 |
| backlog stats | 00:00:00.006 | 0.0% | 3734 | 0.000 | 0.002 | 0.038 |
| callbacks | 00:00:00.000 | 0.0% | 0 | 0.000 | 0.000 | 0.000 |
| data read | 00:00:00.000 | 0.0% | 3 | 0.000 | 0.000 | 0.000 |
| data write | 00:00:00.000 | 0.0% | 3 | 0.000 | 0.000 | 0.000 |
| idle | 23:56:52.402 | 100.0% | 3734 | 17604.943 | 23088.485 | 24050.920 |
| status file | 00:00:00.000 | 0.0% | 6 | 0.000 | 0.000 | 0.000 |
| TOTAL: 23:56:52.453 | 23:56:52.408 | 100.0% | - | - | - | - |
nnrpd timer:
| Code region | Time | Pct | Invoked | Min(ms) | Avg(ms) | Max(ms) |
|---|---|---|---|---|---|---|
| idle | 00:00:00.000 | 0.0% | 0 | 0.000 | 0.000 | 0.000 |
| newnews | 00:00:00.000 | 0.0% | 0 | 0.000 | 0.000 | 0.000 |
| nntpwrite | 00:50:06.085 | 2.5% | 21619111 | 0.000 | 0.139 | 76.250 |
| TOTAL: 34:01:46.935 | 00:50:06.085 | 2.5% | - | - | - | - |
Control commands to INND:
| Command | Number |
|---|---|
| flush | 5 |
| flushlogs | 2 |
| go | 1 |
| logmode | 2 |
| mode | 149 |
| name | 2 |
| pause | 1 |
| paused | 1 |
| reload | 2 |
| renumber | 1 |
| TOTAL: 10 | 166 |
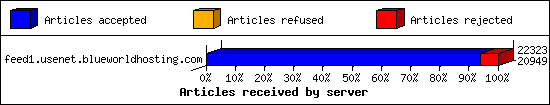
Incoming Feeds (INN):
| Server | Connects | Offered | Taken | Refused | Reject | %Accpt | Elapsed | |
|---|---|---|---|---|---|---|---|---|
| 1 | feed1.usenet.blueworldhosting.com | 8 | 22323 | 20949 | 0 | 1374 | 93% | 24:23:41 |
| TOTAL: 1 | 8 | 22323 | 20949 | 0 | 1374 | 93% | 24:23:41 | |
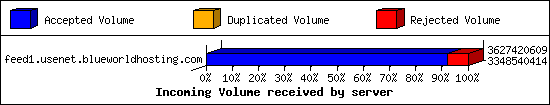
Incoming Volume (INN):
| Server | AcceptVol | DupVol | RejVol | TotalVol | %Acc | Vol/Art | |
|---|---|---|---|---|---|---|---|
| 1 | feed1.usenet.blueworldhosting.com | 3.1 GB | 0.0 KB | 266.0 MB | 3.4 GB | 92% | 158.7 KB |
| TOTAL: 1 | 3.1 GB | 0.0 KB | 266.0 MB | 3.4 GB | 92% | 158.7 KB | |
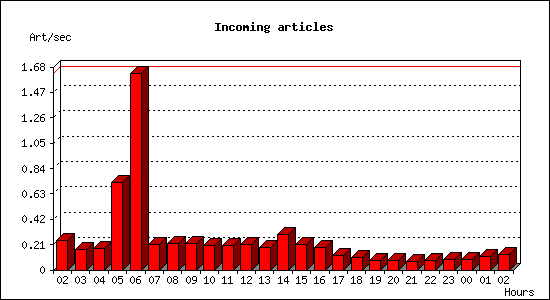
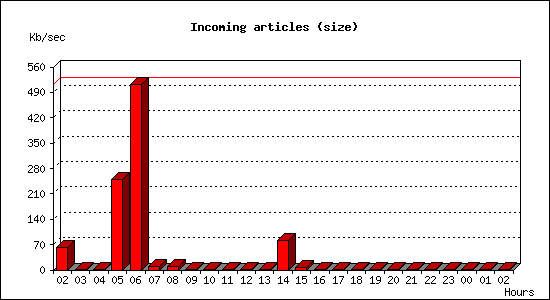
Incoming articles:
| Date | Articles | %Arts | Art/sec | Size | %Size | KB/sec |
|---|---|---|---|---|---|---|
| Jan 10 02:30:00 - 02:59:59 | 441 | 2.1% | 0.24 | 106.8 MB | 3.3% | 60.76 |
| Jan 10 03:00:00 - 03:59:59 | 622 | 3.0% | 0.17 | 3.9 MB | 0.1% | 1.11 |
| Jan 10 04:00:00 - 04:59:59 | 645 | 3.1% | 0.18 | 1.9 MB | 0.1% | 0.54 |
| Jan 10 05:00:00 - 05:59:59 | 2594 | 12.4% | 0.72 | 873.8 MB | 27.4% | 248.54 |
| Jan 10 06:00:00 - 06:59:59 | 5846 | 27.9% | 1.62 | 1.8 GB | 56.2% | 510.45 |
| Jan 10 07:00:00 - 07:59:59 | 755 | 3.6% | 0.21 | 30.3 MB | 0.9% | 8.62 |
| Jan 10 08:00:00 - 08:59:59 | 776 | 3.7% | 0.22 | 37.1 MB | 1.2% | 10.56 |
| Jan 10 09:00:00 - 09:59:59 | 800 | 3.8% | 0.22 | 2.9 MB | 0.1% | 0.82 |
| Jan 10 10:00:00 - 10:59:59 | 731 | 3.5% | 0.20 | 2.0 MB | 0.1% | 0.57 |
| Jan 10 11:00:00 - 11:59:59 | 730 | 3.5% | 0.20 | 2.4 MB | 0.1% | 0.68 |
| Jan 10 12:00:00 - 12:59:59 | 745 | 3.6% | 0.21 | 3.7 MB | 0.1% | 1.05 |
| Jan 10 13:00:00 - 13:59:59 | 676 | 3.2% | 0.19 | 1.9 MB | 0.1% | 0.55 |
| Jan 10 14:00:00 - 14:59:59 | 1048 | 5.0% | 0.29 | 289.8 MB | 9.1% | 82.43 |
| Jan 10 15:00:00 - 15:59:59 | 749 | 3.6% | 0.21 | 22.9 MB | 0.7% | 6.51 |
| Jan 10 16:00:00 - 16:59:59 | 656 | 3.1% | 0.18 | 2.2 MB | 0.1% | 0.64 |
| Jan 10 17:00:00 - 17:59:59 | 428 | 2.0% | 0.12 | 2.5 MB | 0.1% | 0.71 |
| Jan 10 18:00:00 - 18:59:59 | 367 | 1.8% | 0.10 | 2.3 MB | 0.1% | 0.66 |
| Jan 10 19:00:00 - 19:59:59 | 274 | 1.3% | 0.08 | 1.2 MB | 0.0% | 0.34 |
| Jan 10 20:00:00 - 20:59:59 | 286 | 1.4% | 0.08 | 1018.3 KB | 0.0% | 0.28 |
| Jan 10 21:00:00 - 21:59:59 | 249 | 1.2% | 0.07 | 769.4 KB | 0.0% | 0.21 |
| Jan 10 22:00:00 - 22:59:59 | 274 | 1.3% | 0.08 | 864.7 KB | 0.0% | 0.24 |
| Jan 10 23:00:00 - 23:59:59 | 309 | 1.5% | 0.09 | 2.5 MB | 0.1% | 0.72 |
| Jan 11 00:00:00 - 00:59:59 | 298 | 1.4% | 0.08 | 1.6 MB | 0.0% | 0.45 |
| Jan 11 01:00:00 - 01:59:59 | 410 | 2.0% | 0.11 | 3.9 MB | 0.1% | 1.10 |
| Jan 11 02:00:00 - 02:30:00 | 234 | 1.1% | 0.13 | 704.3 KB | 0.0% | 0.39 |
| TOTAL: 24:00:00 | 20943 | 100.0% | 0.24 | 3.1 GB | 100.0% | 37.85 |
Sites sending bad articles:
| Server | Total | Group | Dist | Duplic | Unapp | TooOld | Site | Line | Other | |
|---|---|---|---|---|---|---|---|---|---|---|
| 1 | feed1.usenet.blueworldhosting.com | 1735 | 1308 | 0 | 0 | 0 | 0 | 0 | 0 | 427 |
| TOTAL: 1 | 1735 | 1308 | 0 | 0 | 0 | 0 | 0 | 0 | 427 | |
Unwanted newsgroups [Top 20]:
| Newsgroup | Count |
|---|---|
| alt.binaries.ebook.german | 1086 |
| finet.binaries.keskustelu | 49 |
| wolfsburg.test | 26 |
| alt.binaries.nospam.female.bodyhair | 18 |
| alt.binaries.pictures.scenic | 16 |
| alt.binaries.nospam.female.bodyhair.pubes | 12 |
| alt.binaries.pictures.purebeauty | 9 |
| alt.binaries.pictures.earlmiller | 7 |
| alt.religion.buddhism | 6 |
| alt.binaries.multimedia.cooking | 6 |
| alt.binaries.sounds.karaoke | 5 |
| alt.binaries.adan | 4 |
| alt.binaries.test.yenc | 4 |
| alt.binaries.pictures.wallpaper | 3 |
| alt.binaries.mp3.audiobooks | 3 |
| alt.binaries.pictures.teen-starlets | 3 |
| alt.binaries.sounds.lossless | 3 |
| alt.binaries.pictures.young.celebrities | 3 |
| alt.binaries.pictures.poultry | 2 |
| alt.binaries.multimedia.erotica.amateur | 2 |
| TOTAL: 54 | 1308 |
INND Python filter [Top 20]:
| Reason | Count |
|---|---|
| EMP Body Reject | 16 |
| Bad From (hclaudioblanco@gmail.com) | 16 |
| Bad Subject (Solution Manual ) | 12 |
| Bad Subject (Solution manual ) | 10 |
| Bad From (FBInCIAnNSATerroristSlayer@yahoo.com) | 6 |
| Bad Subject (Buy Xanax) | 5 |
| Bad Subject (Buy Adderall) | 3 |
| TOTAL: 7 | 68 |
Miscellaneous innd statistics [Top 10]:
| Event | Server | Number |
|---|---|---|
| Including strange strings | ||
| feed1.usenet.blueworldhosting.com | 359 | |
| TOTAL: 1 | 359 | |
| TOTAL: 1 | 359 | |
Outgoing Feeds (innfeed) by Articles:
| Server | Offered | Taken | Refused | Reject | Miss | Spool | %Took | Elapsed | |
|---|---|---|---|---|---|---|---|---|---|
| 1 | feed1.usenet.blueworldhosting.com | 0 | 0 | 0 | 0 | 0 | 0 | 0% | 00:10:00 |
| TOTAL: 1 | 0 | 0 | 0 | 0 | 0 | 0 | 0% | 00:10:00 | |
Outgoing Feeds (innfeed) by Volume:
| Server | AcceptVol | RejectVol | TotalVol | Volume/sec | Vol/Art | Elapsed | |
|---|---|---|---|---|---|---|---|
| 1 | feed1.usenet.blueworldhosting.com | 0.0 KB | 0.0 KB | 0.0 KB | 0.0 KB/s | 0 | 00:10:00 |
| TOTAL: 1 | 0.0 KB | 0.0 KB | 0.0 KB | 0.0 KB/s | 0 | 00:10:00 | |
NNRP readership statistics:
| System | Conn | Arts | Size | Groups | Post | Rej | Elapsed | |
|---|---|---|---|---|---|---|---|---|
| 1 | 208.100.26.235 | 12 | 0 | 0.0 KB | 0 | 0 | 0 | 00:00:02 |
| 2 | cool.monitoring.internet-measurement.com | 1 | 0 | 0.0 KB | 0 | 0 | 0 | 00:00:00 |
| 3 | versatile.monitoring.internet-measurement.com | 1 | 0 | 0.0 KB | 0 | 0 | 0 | 00:00:00 |
| 4 | excellent.monitoring.internet-measurement.com | 1 | 0 | 0.0 KB | 0 | 0 | 0 | 00:00:00 |
| 5 | bright.monitoring.internet-measurement.com | 1 | 0 | 0.0 KB | 0 | 0 | 0 | 00:00:00 |
| 6 | willing.monitoring.internet-measurement.com | 1 | 0 | 0.0 KB | 0 | 0 | 0 | 00:00:05 |
| 7 | refreshing.monitoring.internet-measurement.com | 1 | 0 | 0.0 KB | 0 | 0 | 0 | 00:00:00 |
| 8 | c-98-214-113-33.hsd1.il.comcast.net | 1 | 0 | 0.0 KB | 0 | 0 | 0 | 00:00:03 |
| 9 | toma-03.stehlik.co.uk | 1261 | 0 | 0.0 KB | 0 | 0 | 0 | 34:01:28 |
| 10 | fond.monitoring.internet-measurement.com | 1 | 0 | 0.0 KB | 0 | 0 | 0 | 00:00:00 |
| 11 | unwavering.monitoring.internet-measurement.com | 1 | 0 | 0.0 KB | 0 | 0 | 0 | 00:00:00 |
| 12 | elated.monitoring.internet-measurement.com | 1 | 0 | 0.0 KB | 0 | 0 | 0 | 00:00:00 |
| 13 | impressive.monitoring.internet-measurement.com | 1 | 0 | 0.0 KB | 0 | 0 | 0 | 00:00:00 |
| 14 | honourable.monitoring.internet-measurement.com | 1 | 0 | 0.0 KB | 0 | 0 | 0 | 00:00:00 |
| TOTAL: 14 | 1285 | 0 | 0.0 KB | 0 | 0 | 0 | 34:01:40 | |
NNRP readership statistics (by domain):
| System | Conn | Arts | Size | Groups | Post | Rej | Elapsed | |
|---|---|---|---|---|---|---|---|---|
| 1 | *.stehlik.co.uk | 1261 | 0 | 0.0 KB | 0 | 0 | 0 | 34:01:28 |
| 2 | *.monitoring.internet-measurement.com | 11 | 0 | 0.0 KB | 0 | 0 | 0 | 00:00:05 |
| 3 | unresolved | 12 | 0 | 0.0 KB | 0 | 0 | 0 | 00:00:02 |
| 4 | *.hsd1.il.comcast.net | 1 | 0 | 0.0 KB | 0 | 0 | 0 | 00:00:03 |
| TOTAL: 4 | 1285 | 0 | 0.0 KB | 0 | 0 | 0 | 34:01:40 | |
NNRP total resource statistics [Top 20]:
| System | User(ms) | System(ms) | Idle(ms) | Elapsed |
|---|---|---|---|---|
| toma-03.stehlik.co.uk | 284.666 | 98.637 | 0.000 | 34:01:28 |
| willing.monitoring.internet-measurement.com | 0.088 | 0.000 | 0.000 | 00:00:05 |
| c-98-214-113-33.hsd1.il.comcast.net | 0.106 | 0.000 | 0.000 | 00:00:03 |
| 208.100.26.235 | 0.882 | 0.102 | 0.000 | 00:00:02 |
| impressive.monitoring.internet-measurement.com | 0.071 | 0.008 | 0.000 | 00:00:00 |
| elated.monitoring.internet-measurement.com | 0.068 | 0.008 | 0.000 | 00:00:00 |
| TOTAL: 6 | 285.881 | 98.755 | 0.000 | 34:01:40 |
NNRP gethostbyaddr failures [Top 20]:
| System | Conn |
|---|---|
| ? (can't getpeername) | 28 |
| TOTAL: 1 | 28 |
NNRP client timeouts [Top 20]:
| System | Conn | Peer |
|---|---|---|
| toma-03.stehlik.co.uk | 10 | 10 |
| TOTAL: 1 | 10 | 11 |