Log entries by program:
| Program name | Lines | %Lines | Size | %Size |
|---|---|---|---|---|
| nnrpd | 59727 | 51.0% | 4.4 MB | 40.4% |
| inn | 55938 | 47.8% | 6.3 MB | 58.0% |
| innd | 1286 | 1.1% | 160.0 KB | 1.4% |
| innfeed | 157 | 0.1% | 12.5 KB | 0.1% |
| nocem | 7 | 0.0% | 0.7 KB | 0.0% |
| controlchan | 1 | 0.0% | 0.0 KB | 0.0% |
| TOTAL: 6 | 117116 | 100.0% | 10.9 MB | 100.0% |
History cache:
| Reason | Count | %Count |
|---|---|---|
| Do not exist | 55449 | 88.9% |
| Negative hits | 6929 | 11.1% |
| Positive hits | 5 | 0.0% |
| Cache misses | 2 | 0.0% |
| TOTAL: 4 | 62385 | 100.0% |
INND timer:
| Code region | Time | Pct | Invoked | Min(ms) | Avg(ms) | Max(ms) |
|---|---|---|---|---|---|---|
| article cancel | 00:00:00.207 | 0.0% | 66 | 0.000 | 3.136 | 17.000 |
| article cleanup | 00:00:00.560 | 0.0% | 55501 | 0.000 | 0.010 | 0.052 |
| article logging | 00:00:00.951 | 0.0% | 55945 | 0.000 | 0.017 | 0.060 |
| article parse | 00:00:42.220 | 0.0% | 3621331 | 0.000 | 0.012 | 0.043 |
| article write | 00:07:53.338 | 0.5% | 49284 | 0.213 | 9.604 | 13.459 |
| artlog/artcncl | 00:00:00.000 | 0.0% | 7 | 0.000 | 0.000 | 0.000 |
| data move | 00:00:04.322 | 0.0% | 3993852 | 0.000 | 0.001 | 0.014 |
| hisgrep/artcncl | 00:00:00.036 | 0.0% | 70 | 0.000 | 0.514 | 10.000 |
| hishave/artcncl | 00:00:00.000 | 0.0% | 7 | 0.000 | 0.000 | 0.000 |
| history grep | 00:00:00.000 | 0.0% | 0 | 0.000 | 0.000 | 0.000 |
| history lookup | 00:00:09.533 | 0.0% | 62430 | 0.041 | 0.153 | 0.536 |
| history sync | 00:00:06.524 | 0.0% | 406 | 5.667 | 16.069 | 46.333 |
| history write | 00:02:00.182 | 0.1% | 55501 | 1.282 | 2.165 | 3.514 |
| idle | 23:29:21.635 | 97.8% | 3617700 | 0.868 | 23.374 | 12795.000 |
| nntp read | 00:02:44.093 | 0.2% | 3617416 | 0.000 | 0.045 | 0.107 |
| overview write | 00:00:10.718 | 0.0% | 49284 | 0.107 | 0.217 | 2.892 |
| perl filter | 00:00:06.240 | 0.0% | 55396 | 0.000 | 0.113 | 0.178 |
| python filter | 00:17:31.191 | 1.2% | 55501 | 0.727 | 18.940 | 35.643 |
| site send | 00:00:01.552 | 0.0% | 49350 | 0.000 | 0.031 | 0.377 |
| TOTAL: 24:01:19.079 | 24:00:53.302 | 100.0% | - | - | - | - |
INNfeed timer:
| Code region | Time | Pct | Invoked | Min(ms) | Avg(ms) | Max(ms) |
|---|---|---|---|---|---|---|
| article new | 00:00:00.000 | 0.0% | 0 | 0.000 | 0.000 | 0.000 |
| article prepare | 00:00:00.000 | 0.0% | 0 | 0.000 | 0.000 | 0.000 |
| article read | 00:00:00.000 | 0.0% | 0 | 0.000 | 0.000 | 0.000 |
| backlog stats | 00:00:00.004 | 0.0% | 3730 | 0.000 | 0.001 | 0.038 |
| callbacks | 00:00:00.000 | 0.0% | 0 | 0.000 | 0.000 | 0.000 |
| data read | 00:00:00.000 | 0.0% | 3 | 0.000 | 0.000 | 0.000 |
| data write | 00:00:00.000 | 0.0% | 3 | 0.000 | 0.000 | 0.000 |
| idle | 23:55:36.083 | 100.0% | 3730 | 18198.212 | 23092.784 | 24146.000 |
| status file | 00:00:00.000 | 0.0% | 6 | 0.000 | 0.000 | 0.000 |
| TOTAL: 23:55:36.147 | 23:55:36.087 | 100.0% | - | - | - | - |
nnrpd timer:
| Code region | Time | Pct | Invoked | Min(ms) | Avg(ms) | Max(ms) |
|---|---|---|---|---|---|---|
| idle | 00:00:00.000 | 0.0% | 0 | 0.000 | 0.000 | 0.000 |
| newnews | 00:00:00.000 | 0.0% | 0 | 0.000 | 0.000 | 0.000 |
| nntpwrite | 00:34:05.188 | 2.3% | 16212858 | 0.000 | 0.126 | 16.375 |
| TOTAL: 24:25:14.084 | 00:34:05.188 | 2.3% | - | - | - | - |
Control commands to INND:
| Command | Number |
|---|---|
| flush | 5 |
| flushlogs | 2 |
| go | 1 |
| logmode | 2 |
| mode | 149 |
| name | 2 |
| pause | 1 |
| paused | 1 |
| reload | 2 |
| renumber | 1 |
| TOTAL: 10 | 166 |
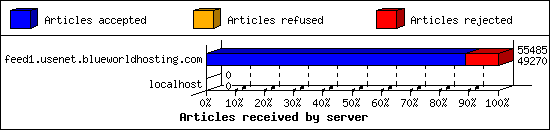
Incoming Feeds (INN):
| Server | Connects | Offered | Taken | Refused | Reject | %Accpt | Elapsed | |
|---|---|---|---|---|---|---|---|---|
| 1 | feed1.usenet.blueworldhosting.com | 14 | 55485 | 49270 | 0 | 6215 | 88% | 25:09:51 |
| 2 | localhost | 1 | 0 | 0 | 0 | 0 | 0% | 00:00:00 |
| TOTAL: 2 | 15 | 55485 | 49270 | 0 | 6215 | 88% | 25:09:51 | |
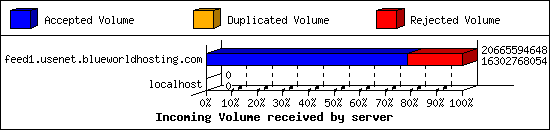
Incoming Volume (INN):
| Server | AcceptVol | DupVol | RejVol | TotalVol | %Acc | Vol/Art | |
|---|---|---|---|---|---|---|---|
| 1 | feed1.usenet.blueworldhosting.com | 15.2 GB | 0.0 KB | 4.1 GB | 19.2 GB | 78% | 363.7 KB |
| 2 | localhost | 0.0 KB | 0.0 KB | 0.0 KB | 0.0 KB | 0% | 0 |
| TOTAL: 2 | 15.2 GB | 0.0 KB | 4.1 GB | 19.2 GB | 78% | 363.7 KB | |
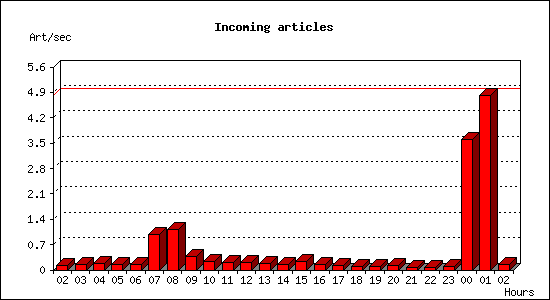
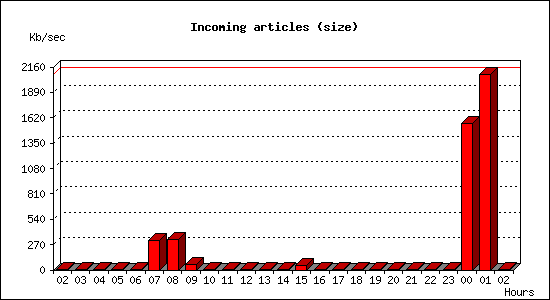
Incoming articles:
| Date | Articles | %Arts | Art/sec | Size | %Size | KB/sec |
|---|---|---|---|---|---|---|
| Jan 12 02:30:00 - 02:59:59 | 236 | 0.5% | 0.13 | 909.9 KB | 0.0% | 0.51 |
| Jan 12 03:00:00 - 03:59:59 | 549 | 1.1% | 0.15 | 1.5 MB | 0.0% | 0.43 |
| Jan 12 04:00:00 - 04:59:59 | 606 | 1.2% | 0.17 | 1.7 MB | 0.0% | 0.48 |
| Jan 12 05:00:00 - 05:59:59 | 528 | 1.1% | 0.15 | 1.7 MB | 0.0% | 0.47 |
| Jan 12 06:00:00 - 06:59:59 | 523 | 1.1% | 0.15 | 1.7 MB | 0.0% | 0.48 |
| Jan 12 07:00:00 - 07:59:59 | 3552 | 7.2% | 0.99 | 1.1 GB | 7.1% | 314.23 |
| Jan 12 08:00:00 - 08:59:59 | 4016 | 8.2% | 1.12 | 1.1 GB | 7.4% | 328.26 |
| Jan 12 09:00:00 - 09:59:59 | 1338 | 2.7% | 0.37 | 218.8 MB | 1.4% | 62.23 |
| Jan 12 10:00:00 - 10:59:59 | 823 | 1.7% | 0.23 | 8.4 MB | 0.1% | 2.39 |
| Jan 12 11:00:00 - 11:59:59 | 759 | 1.5% | 0.21 | 2.5 MB | 0.0% | 0.72 |
| Jan 12 12:00:00 - 12:59:59 | 774 | 1.6% | 0.21 | 2.3 MB | 0.0% | 0.66 |
| Jan 12 13:00:00 - 13:59:59 | 622 | 1.3% | 0.17 | 2.7 MB | 0.0% | 0.76 |
| Jan 12 14:00:00 - 14:59:59 | 577 | 1.2% | 0.16 | 3.0 MB | 0.0% | 0.85 |
| Jan 12 15:00:00 - 15:59:59 | 845 | 1.7% | 0.23 | 178.5 MB | 1.1% | 50.79 |
| Jan 12 16:00:00 - 16:59:59 | 571 | 1.2% | 0.16 | 18.7 MB | 0.1% | 5.33 |
| Jan 12 17:00:00 - 17:59:59 | 453 | 0.9% | 0.13 | 1.8 MB | 0.0% | 0.51 |
| Jan 12 18:00:00 - 18:59:59 | 311 | 0.6% | 0.09 | 1.9 MB | 0.0% | 0.54 |
| Jan 12 19:00:00 - 19:59:59 | 349 | 0.7% | 0.10 | 1.1 MB | 0.0% | 0.30 |
| Jan 12 20:00:00 - 20:59:59 | 401 | 0.8% | 0.11 | 1.3 MB | 0.0% | 0.38 |
| Jan 12 21:00:00 - 21:59:59 | 246 | 0.5% | 0.07 | 770.4 KB | 0.0% | 0.21 |
| Jan 12 22:00:00 - 22:59:59 | 281 | 0.6% | 0.08 | 20.9 MB | 0.1% | 5.94 |
| Jan 12 23:00:00 - 23:59:59 | 345 | 0.7% | 0.10 | 9.0 MB | 0.1% | 2.57 |
| Jan 13 00:00:00 - 00:59:59 | 12979 | 26.3% | 3.61 | 5.4 GB | 35.3% | 1559.24 |
| Jan 13 01:00:00 - 01:59:59 | 17326 | 35.2% | 4.81 | 7.1 GB | 47.1% | 2082.29 |
| Jan 13 02:00:00 - 02:30:00 | 260 | 0.5% | 0.14 | 7.3 MB | 0.0% | 4.16 |
| TOTAL: 24:00:00 | 49270 | 100.0% | 0.57 | 15.2 GB | 100.0% | 184.27 |
Sites sending bad articles:
| Server | Total | Group | Dist | Duplic | Unapp | TooOld | Site | Line | Other | |
|---|---|---|---|---|---|---|---|---|---|---|
| 1 | feed1.usenet.blueworldhosting.com | 6661 | 6112 | 0 | 0 | 0 | 0 | 0 | 0 | 549 |
| TOTAL: 1 | 6661 | 6112 | 0 | 0 | 0 | 0 | 0 | 0 | 549 | |
Unwanted newsgroups [Top 20]:
| Newsgroup | Count |
|---|---|
| alt.binaries.ebooks.german | 5944 |
| finet.binaries.keskustelu | 41 |
| alt.binaries.pictures.earlmiller | 11 |
| alt.binaries.pictures.scenic | 10 |
| alt.binaries.sounds.lossless | 8 |
| rocksolid.nodes.help | 7 |
| alt.binaries.pictures.wallpaper | 6 |
| alt.binaries.pictures.purebeauty | 6 |
| alt.binaries.pictures.rail | 5 |
| alt.binaries.nospam.female.bodyhair.pubes | 5 |
| alt.binaries.nospam.female.bodyhair | 4 |
| alt.binaries.test.yenc | 4 |
| alt.religion.buddhism | 4 |
| alt.binaries.multimedia.erotica.amateur | 4 |
| alt.binaries.pictures.poultry | 3 |
| alt.binaries.pictures.teen-starlets | 3 |
| alt.binaries.boneless | 3 |
| newsreader.test | 3 |
| alt.binaries.automobile.pictures | 3 |
| alt.binaries.nospam.multimedia.facials | 2 |
| TOTAL: 49 | 6112 |
INND Python filter [Top 20]:
| Reason | Count |
|---|---|
| EMP Body Reject | 62 |
| Bad From (PHARMA GRADE) | 11 |
| Bad From (FBInCIAnNSATerroristSlayer@yahoo.com) | 9 |
| Bad Subject (Buy Adderall) | 9 |
| Bad Subject (Buy Xanax) | 8 |
| Bad Subject (Buy Oxycodon) | 3 |
| Bad From (dr.jamesmoore202@gmail.com) | 2 |
| Bad Subject (Buy Hydrocodone) | 1 |
| Bad Subject (Solution Manual ) | 1 |
| TOTAL: 9 | 106 |
NoCeM on Spool:
| Id | Good | Bad | Unique | Total |
|---|---|---|---|---|
| bleachbot@httrack.com | 3 | 0 | 3 | 3 |
| TOTAL: 1 | 3 | 0 | 3 | 3 |
Miscellaneous innd statistics [Top 10]:
| Event | Server | Number |
|---|---|---|
| Including strange strings | ||
| feed1.usenet.blueworldhosting.com | 443 | |
| TOTAL: 1 | 443 | |
| TOTAL: 1 | 443 | |
Outgoing Feeds (innfeed) by Articles:
| Server | Offered | Taken | Refused | Reject | Miss | Spool | %Took | Elapsed | |
|---|---|---|---|---|---|---|---|---|---|
| 1 | feed1.usenet.blueworldhosting.com | 0 | 0 | 0 | 0 | 0 | 0 | 0% | 00:10:01 |
| TOTAL: 1 | 0 | 0 | 0 | 0 | 0 | 0 | 0% | 00:10:01 | |
Outgoing Feeds (innfeed) by Volume:
| Server | AcceptVol | RejectVol | TotalVol | Volume/sec | Vol/Art | Elapsed | |
|---|---|---|---|---|---|---|---|
| 1 | feed1.usenet.blueworldhosting.com | 0.0 KB | 0.0 KB | 0.0 KB | 0.0 KB/s | 0 | 00:10:01 |
| TOTAL: 1 | 0.0 KB | 0.0 KB | 0.0 KB | 0.0 KB/s | 0 | 00:10:01 | |
NNRP readership statistics:
| System | Conn | Arts | Size | Groups | Post | Rej | Elapsed | |
|---|---|---|---|---|---|---|---|---|
| 1 | c-98-214-113-33.hsd1.il.comcast.net | 1 | 0 | 0.0 KB | 0 | 0 | 0 | 00:00:01 |
| 2 | 104.156.155.18 | 96 | 0 | 0.0 KB | 0 | 0 | 0 | 00:00:21 |
| 3 | toma-03.stehlik.co.uk | 1010 | 0 | 0.0 KB | 0 | 0 | 0 | 24:24:45 |
| TOTAL: 3 | 1107 | 0 | 0.0 KB | 0 | 0 | 0 | 24:25:08 | |
NNRP readership statistics (by domain):
| System | Conn | Arts | Size | Groups | Post | Rej | Elapsed | |
|---|---|---|---|---|---|---|---|---|
| 1 | unresolved | 96 | 0 | 0.0 KB | 0 | 0 | 0 | 00:00:21 |
| 2 | *.stehlik.co.uk | 1010 | 0 | 0.0 KB | 0 | 0 | 0 | 24:24:45 |
| 3 | *.hsd1.il.comcast.net | 1 | 0 | 0.0 KB | 0 | 0 | 0 | 00:00:01 |
| TOTAL: 3 | 1107 | 0 | 0.0 KB | 0 | 0 | 0 | 24:25:08 | |
NNRP total resource statistics [Top 20]:
| System | User(ms) | System(ms) | Idle(ms) | Elapsed |
|---|---|---|---|---|
| toma-03.stehlik.co.uk | 220.596 | 74.186 | 0.000 | 24:24:45 |
| 104.156.155.18 | 7.365 | 0.916 | 0.000 | 00:00:21 |
| c-98-214-113-33.hsd1.il.comcast.net | 0.071 | 0.021 | 0.000 | 00:00:01 |
| TOTAL: 3 | 228.032 | 75.123 | 0.000 | 24:25:08 |
NNRP client timeouts [Top 20]:
| System | Conn | Peer |
|---|---|---|
| toma-03.stehlik.co.uk | 10 | 10 |
| TOTAL: 1 | 10 | 10 |