Log entries by program:
| Program name | Lines | %Lines | Size | %Size |
|---|---|---|---|---|
| inn | 128854 | 63.5% | 15.7 MB | 70.7% |
| nnrpd | 72327 | 35.7% | 6.3 MB | 28.4% |
| innd | 1534 | 0.8% | 192.6 KB | 0.8% |
| innfeed | 156 | 0.1% | 13.1 KB | 0.1% |
| controlchan | 1 | 0.0% | 0.0 KB | 0.0% |
| nocem | 1 | 0.0% | 0.0 KB | 0.0% |
| TOTAL: 6 | 202873 | 100.0% | 22.3 MB | 100.0% |
History cache:
| Reason | Count | %Count |
|---|---|---|
| Do not exist | 128433 | 71.5% |
| Negative hits | 51266 | 28.5% |
| Positive hits | 3 | 0.0% |
| Cache misses | 3 | 0.0% |
| TOTAL: 4 | 179705 | 100.0% |
INND timer:
| Code region | Time | Pct | Invoked | Min(ms) | Avg(ms) | Max(ms) |
|---|---|---|---|---|---|---|
| article cancel | 00:00:01.321 | 0.0% | 107 | 0.000 | 12.346 | 301.000 |
| article cleanup | 00:00:01.354 | 0.0% | 128472 | 0.000 | 0.011 | 0.049 |
| article logging | 00:00:02.537 | 0.0% | 128864 | 0.000 | 0.020 | 0.390 |
| article parse | 00:02:42.847 | 0.2% | 13872871 | 0.000 | 0.012 | 0.057 |
| article write | 00:40:19.801 | 2.8% | 82954 | 2.606 | 29.170 | 45.603 |
| artlog/artcncl | 00:00:00.001 | 0.0% | 6 | 0.000 | 0.167 | 1.000 |
| data move | 00:00:16.361 | 0.0% | 15060896 | 0.000 | 0.001 | 0.011 |
| hisgrep/artcncl | 00:00:00.542 | 0.0% | 113 | 0.000 | 4.796 | 37.000 |
| hishave/artcncl | 00:00:00.000 | 0.0% | 6 | 0.000 | 0.000 | 0.000 |
| history grep | 00:00:00.000 | 0.0% | 0 | 0.000 | 0.000 | 0.000 |
| history lookup | 00:12:22.568 | 0.9% | 179738 | 0.499 | 4.131 | 32.886 |
| history sync | 00:00:20.897 | 0.0% | 381 | 0.000 | 54.848 | 420.000 |
| history write | 00:31:07.773 | 2.2% | 128472 | 4.925 | 14.538 | 33.683 |
| idle | 21:12:21.364 | 88.3% | 13874782 | 0.706 | 5.502 | 9352.328 |
| nntp read | 00:11:28.621 | 0.8% | 13874527 | 0.000 | 0.050 | 0.201 |
| overview write | 00:02:02.718 | 0.1% | 82954 | 0.248 | 1.479 | 41.543 |
| perl filter | 00:00:22.786 | 0.0% | 128417 | 0.000 | 0.177 | 0.231 |
| python filter | 01:06:14.479 | 4.6% | 128472 | 0.725 | 30.937 | 37.378 |
| site send | 00:00:02.316 | 0.0% | 83056 | 0.000 | 0.028 | 0.168 |
| TOTAL: 24:00:54.693 | 23:59:48.286 | 99.9% | - | - | - | - |
INNfeed timer:
| Code region | Time | Pct | Invoked | Min(ms) | Avg(ms) | Max(ms) |
|---|---|---|---|---|---|---|
| article new | 00:00:00.000 | 0.0% | 0 | 0.000 | 0.000 | 0.000 |
| article prepare | 00:00:00.000 | 0.0% | 0 | 0.000 | 0.000 | 0.000 |
| article read | 00:00:00.000 | 0.0% | 0 | 0.000 | 0.000 | 0.000 |
| backlog stats | 00:00:00.005 | 0.0% | 3729 | 0.000 | 0.001 | 0.038 |
| callbacks | 00:00:00.000 | 0.0% | 0 | 0.000 | 0.000 | 0.000 |
| data read | 00:00:00.000 | 0.0% | 3 | 0.000 | 0.000 | 0.000 |
| data write | 00:00:00.000 | 0.0% | 3 | 0.000 | 0.000 | 0.000 |
| idle | 23:52:40.311 | 100.0% | 3729 | 17421.486 | 23051.840 | 24034.080 |
| status file | 00:00:00.002 | 0.0% | 6 | 0.250 | 0.333 | 0.500 |
| TOTAL: 23:52:40.354 | 23:52:40.318 | 100.0% | - | - | - | - |
nnrpd timer:
| Code region | Time | Pct | Invoked | Min(ms) | Avg(ms) | Max(ms) |
|---|---|---|---|---|---|---|
| hisgrep | 00:00:27.622 | 0.0% | 17146 | 0.000 | 1.611 | 10.000 |
| idle | 00:00:00.000 | 0.0% | 0 | 0.000 | 0.000 | 0.000 |
| newnews | 00:00:00.000 | 0.0% | 0 | 0.000 | 0.000 | 0.000 |
| nntpwrite | 00:52:24.172 | 2.4% | 14216277 | 0.000 | 0.221 | 224.342 |
| readart | 00:01:28.152 | 0.1% | 17146 | 0.000 | 5.141 | 33.000 |
| TOTAL: 35:41:24.244 | 00:54:19.946 | 2.5% | - | - | - | - |
Control commands to INND:
| Command | Number |
|---|---|
| flush | 5 |
| flushlogs | 2 |
| go | 1 |
| logmode | 2 |
| mode | 148 |
| name | 2 |
| pause | 1 |
| paused | 1 |
| reload | 2 |
| renumber | 1 |
| TOTAL: 10 | 165 |
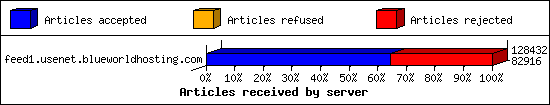
Incoming Feeds (INN):
| Server | Connects | Offered | Taken | Refused | Reject | %Accpt | Elapsed | |
|---|---|---|---|---|---|---|---|---|
| 1 | feed1.usenet.blueworldhosting.com | 7 | 128432 | 82916 | 0 | 45516 | 64% | 24:13:35 |
| TOTAL: 1 | 7 | 128432 | 82916 | 0 | 45516 | 64% | 24:13:35 | |
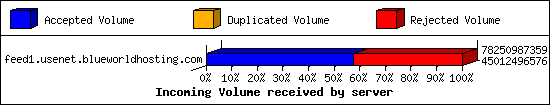
Incoming Volume (INN):
| Server | AcceptVol | DupVol | RejVol | TotalVol | %Acc | Vol/Art | |
|---|---|---|---|---|---|---|---|
| 1 | feed1.usenet.blueworldhosting.com | 41.9 GB | 0.0 KB | 31.0 GB | 72.9 GB | 57% | 595.0 KB |
| TOTAL: 1 | 41.9 GB | 0.0 KB | 31.0 GB | 72.9 GB | 57% | 595.0 KB | |
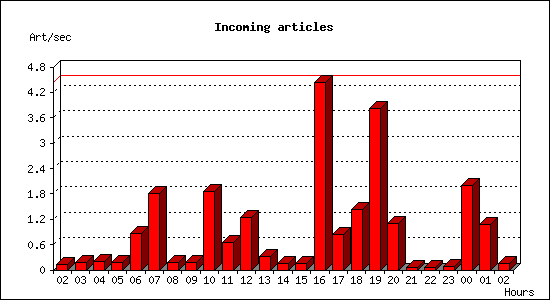
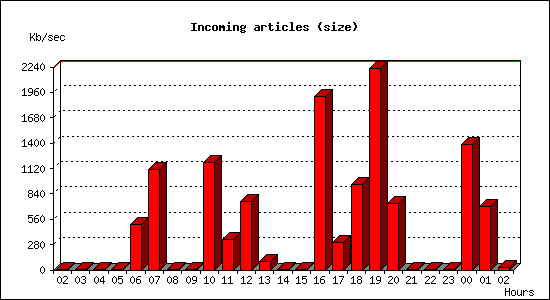
Incoming articles:
| Date | Articles | %Arts | Art/sec | Size | %Size | KB/sec |
|---|---|---|---|---|---|---|
| Jan 14 02:30:00 - 02:59:59 | 247 | 0.3% | 0.14 | 1.6 MB | 0.0% | 0.92 |
| Jan 14 03:00:00 - 03:59:59 | 645 | 0.8% | 0.18 | 3.3 MB | 0.0% | 0.94 |
| Jan 14 04:00:00 - 04:59:59 | 717 | 0.9% | 0.20 | 4.6 MB | 0.0% | 1.32 |
| Jan 14 05:00:00 - 05:59:59 | 629 | 0.8% | 0.17 | 1.9 MB | 0.0% | 0.53 |
| Jan 14 06:00:00 - 06:59:59 | 3149 | 3.8% | 0.87 | 1.7 GB | 4.1% | 503.21 |
| Jan 14 07:00:00 - 07:59:59 | 6477 | 7.8% | 1.80 | 3.8 GB | 9.1% | 1105.89 |
| Jan 14 08:00:00 - 08:59:59 | 667 | 0.8% | 0.19 | 3.3 MB | 0.0% | 0.94 |
| Jan 14 09:00:00 - 09:59:59 | 678 | 0.8% | 0.19 | 3.0 MB | 0.0% | 0.87 |
| Jan 14 10:00:00 - 10:59:59 | 6659 | 8.0% | 1.85 | 4.1 GB | 9.7% | 1186.44 |
| Jan 14 11:00:00 - 11:59:59 | 2371 | 2.9% | 0.66 | 1.2 GB | 2.8% | 338.27 |
| Jan 14 12:00:00 - 12:59:59 | 4481 | 5.4% | 1.24 | 2.6 GB | 6.2% | 758.48 |
| Jan 14 13:00:00 - 13:59:59 | 1148 | 1.4% | 0.32 | 343.2 MB | 0.8% | 97.62 |
| Jan 14 14:00:00 - 14:59:59 | 595 | 0.7% | 0.17 | 1.5 MB | 0.0% | 0.42 |
| Jan 14 15:00:00 - 15:59:59 | 594 | 0.7% | 0.17 | 3.1 MB | 0.0% | 0.87 |
| Jan 14 16:00:00 - 16:59:59 | 15996 | 19.3% | 4.44 | 6.6 GB | 15.6% | 1910.40 |
| Jan 14 17:00:00 - 17:59:59 | 2986 | 3.6% | 0.83 | 1.0 GB | 2.4% | 298.00 |
| Jan 14 18:00:00 - 18:59:59 | 5142 | 6.2% | 1.43 | 3.3 GB | 7.8% | 947.82 |
| Jan 14 19:00:00 - 19:59:59 | 13739 | 16.6% | 3.82 | 7.6 GB | 18.2% | 2219.78 |
| Jan 14 20:00:00 - 20:59:59 | 3921 | 4.7% | 1.09 | 2.5 GB | 6.0% | 733.33 |
| Jan 14 21:00:00 - 21:59:59 | 235 | 0.3% | 0.07 | 731.3 KB | 0.0% | 0.20 |
| Jan 14 22:00:00 - 22:59:59 | 216 | 0.3% | 0.06 | 1.3 MB | 0.0% | 0.36 |
| Jan 14 23:00:00 - 23:59:59 | 259 | 0.3% | 0.07 | 2.1 MB | 0.0% | 0.60 |
| Jan 15 00:00:00 - 00:59:59 | 7228 | 8.7% | 2.01 | 4.8 GB | 11.3% | 1385.21 |
| Jan 15 01:00:00 - 01:59:59 | 3865 | 4.7% | 1.07 | 2.4 GB | 5.8% | 703.62 |
| Jan 15 02:00:00 - 02:30:00 | 293 | 0.4% | 0.16 | 54.8 MB | 0.1% | 31.18 |
| TOTAL: 24:00:00 | 82937 | 100.0% | 0.96 | 41.9 GB | 100.0% | 508.80 |
Sites sending bad articles:
| Server | Total | Group | Dist | Duplic | Unapp | TooOld | Site | Line | Other | |
|---|---|---|---|---|---|---|---|---|---|---|
| 1 | feed1.usenet.blueworldhosting.com | 45911 | 45463 | 0 | 0 | 0 | 0 | 0 | 0 | 448 |
| TOTAL: 1 | 45911 | 45463 | 0 | 0 | 0 | 0 | 0 | 0 | 448 | |
Unwanted newsgroups [Top 20]:
| Newsgroup | Count |
|---|---|
| alt.binaries.ebooks.german | 26091 |
| alt.binaries.ebook.german | 19128 |
| finet.binaries.keskustelu | 47 |
| alt.binaries.nospam.female.bodyhair | 25 |
| alt.binaries.pictures.rail | 20 |
| alt.binaries.pictures.purebeauty | 18 |
| alt.binaries.pictures.wallpaper | 16 |
| alt.binaries.pictures.scenic | 16 |
| alt.binaries.nospam.female.bodyhair.pubes | 10 |
| alt.binaries.pictures.earlmiller | 10 |
| alt.binaries.test.yenc | 6 |
| alt.religion.buddhism | 6 |
| alt.binaries.multimedia.cooking | 5 |
| alt.binaries.drwho | 4 |
| alt.binaries.sounds.lossless.classical | 4 |
| alt.binaries.movies.thelostmovies | 4 |
| alt.binaries.pictures.teen-starlets | 3 |
| de.comm.geraete.mobil.misc | 3 |
| alt.binaries.pictures.erotica.transexual.action | 2 |
| alt.binaries.pictures.pantyhose | 2 |
| TOTAL: 56 | 45463 |
INND Python filter [Top 20]:
| Reason | Count |
|---|---|
| Bad Subject (Solution manual ) | 19 |
| EMP Body Reject | 9 |
| Bad Subject (Buy Adderall) | 8 |
| Bad Subject (Solution Manual ) | 8 |
| Bad From (FBInCIAnNSATerroristSlayer@yahoo.com) | 4 |
| Bad Subject (Buy Ketamine) | 3 |
| Bad Subject (Buy Xanax) | 2 |
| Bad Subject (Buy Morphine) | 1 |
| Bad Subject (Buy Oxycodon) | 1 |
| TOTAL: 9 | 55 |
Miscellaneous innd statistics [Top 10]:
| Event | Server | Number |
|---|---|---|
| Including strange strings | ||
| feed1.usenet.blueworldhosting.com | 393 | |
| TOTAL: 1 | 393 | |
| TOTAL: 1 | 393 | |
Outgoing Feeds (innfeed) by Articles:
| Server | Offered | Taken | Refused | Reject | Miss | Spool | %Took | Elapsed | |
|---|---|---|---|---|---|---|---|---|---|
| 1 | feed1.usenet.blueworldhosting.com | 0 | 0 | 0 | 0 | 0 | 0 | 0% | 00:10:01 |
| TOTAL: 1 | 0 | 0 | 0 | 0 | 0 | 0 | 0% | 00:10:01 | |
Outgoing Feeds (innfeed) by Volume:
| Server | AcceptVol | RejectVol | TotalVol | Volume/sec | Vol/Art | Elapsed | |
|---|---|---|---|---|---|---|---|
| 1 | feed1.usenet.blueworldhosting.com | 0.0 KB | 0.0 KB | 0.0 KB | 0.0 KB/s | 0 | 00:10:01 |
| TOTAL: 1 | 0.0 KB | 0.0 KB | 0.0 KB | 0.0 KB/s | 0 | 00:10:01 | |
NNRP readership statistics:
| System | Conn | Arts | Size | Groups | Post | Rej | Elapsed | |
|---|---|---|---|---|---|---|---|---|
| 1 | 023-084-030-207.res.spectrum.com | 210 | 1 | 3.9 KB | 1 | 17145 | 0 | 13:30:43 |
| TOTAL: 1 | 210 | 1 | 3.9 KB | 1 | 17145 | 0 | 35:41:17 | |
NNRP readership statistics (by domain):
| System | Conn | Arts | Size | Groups | Post | Rej | Elapsed | |
|---|---|---|---|---|---|---|---|---|
| 1 | *.res.spectrum.com | 210 | 1 | 3.9 KB | 1 | 17145 | 0 | 13:30:43 |
| 2 | *.stehlik.co.uk | 884 | 0 | 0.0 KB | 0 | 0 | 0 | 22:10:25 |
| 3 | unresolved | 12 | 0 | 0.0 KB | 0 | 0 | 0 | 00:00:08 |
| TOTAL: 3 | 1106 | 1 | 3.9 KB | 1 | 17145 | 0 | 35:41:17 | |
NNRP auth users [Top 20]:
| User | Conn |
|---|---|
| jesse | 210 |
| TOTAL: 1 | 210 |
NNRP total resource statistics [Top 20]:
| System | User(ms) | System(ms) | Idle(ms) | Elapsed |
|---|---|---|---|---|
| toma-03.stehlik.co.uk | 201.655 | 87.964 | 0.000 | 22:10:25 |
| 023-084-030-207.res.spectrum.com | 447.122 | 505.513 | 2.089 | 13:30:43 |
| 152.32.198.51 | 0.854 | 0.155 | 0.000 | 00:00:08 |
| TOTAL: 3 | 649.631 | 593.632 | 2.089 | 35:41:17 |
Curious NNRP server explorers [Top 20]:
| System | Conn |
|---|---|
| toma-03.stehlik.co.uk | 884 |
| 152.32.198.51 | 12 |
| TOTAL: 2 | 896 |
NNRP gethostbyaddr failures [Top 20]:
| System | Conn |
|---|---|
| ? (can't getpeername) | 3 |
| TOTAL: 1 | 3 |
NNRP client timeouts [Top 20]:
| System | Conn | Peer |
|---|---|---|
| 023-084-030-207.res.spectrum.com | 182 | 182 |
| TOTAL: 1 | 182 | 183 |
Newsgroup request counts (by hierarchy):
| Hierarchy | Count | Pct | |
|---|---|---|---|
| 1 | alt | 1 | 100.0% |
| TOTAL: 1 | 1 | 100.0% | |
Newsgroup request counts (by newsgroup) [Top 100]:
| Newsgroup | Count | |
|---|---|---|
| 1 | alt.binaries.multimedia.documentaries | 1 |
| TOTAL: 1 | 1 | |