Log entries by program:
| Program name | Lines | %Lines | Size | %Size |
|---|---|---|---|---|
| nnrpd | 55037 | 73.3% | 4.1 MB | 64.2% |
| inn | 18885 | 25.1% | 2.1 MB | 33.4% |
| innd | 1049 | 1.4% | 147.3 KB | 2.3% |
| innfeed | 155 | 0.2% | 12.1 KB | 0.2% |
| controlchan | 1 | 0.0% | 0.1 KB | 0.0% |
| TOTAL: 5 | 75127 | 100.0% | 6.4 MB | 100.0% |
History cache:
| Reason | Count | %Count |
|---|---|---|
| Do not exist | 18494 | 95.7% |
| Negative hits | 827 | 4.3% |
| Positive hits | 12 | 0.1% |
| Cache misses | 1 | 0.0% |
| TOTAL: 4 | 19334 | 100.0% |
INND timer:
| Code region | Time | Pct | Invoked | Min(ms) | Avg(ms) | Max(ms) |
|---|---|---|---|---|---|---|
| article cancel | 00:00:04.921 | 0.0% | 144 | 0.000 | 34.174 | 929.000 |
| article cleanup | 00:00:00.156 | 0.0% | 18520 | 0.000 | 0.008 | 0.152 |
| article logging | 00:00:00.378 | 0.0% | 18893 | 0.000 | 0.020 | 0.378 |
| article parse | 00:00:04.398 | 0.0% | 349787 | 0.000 | 0.013 | 0.056 |
| article write | 00:10:58.688 | 0.8% | 18266 | 6.689 | 36.061 | 84.200 |
| artlog/artcncl | 00:00:00.000 | 0.0% | 13 | 0.000 | 0.000 | 0.000 |
| data move | 00:00:00.590 | 0.0% | 387074 | 0.000 | 0.002 | 0.013 |
| hisgrep/artcncl | 00:00:01.475 | 0.0% | 157 | 0.000 | 9.395 | 78.500 |
| hishave/artcncl | 00:00:00.000 | 0.0% | 13 | 0.000 | 0.000 | 0.000 |
| history grep | 00:00:00.000 | 0.0% | 0 | 0.000 | 0.000 | 0.000 |
| history lookup | 00:05:04.532 | 0.4% | 19347 | 2.628 | 15.741 | 57.323 |
| history sync | 00:01:15.193 | 0.1% | 410 | 15.667 | 183.398 | 688.333 |
| history write | 00:09:52.277 | 0.7% | 18520 | 13.630 | 31.980 | 89.032 |
| idle | 23:25:49.884 | 97.5% | 349364 | 3.527 | 241.438 | 9811.180 |
| nntp read | 00:00:20.896 | 0.0% | 349070 | 0.000 | 0.060 | 0.250 |
| overview write | 00:05:52.708 | 0.4% | 18266 | 1.811 | 19.310 | 84.919 |
| perl filter | 00:00:01.166 | 0.0% | 18415 | 0.000 | 0.063 | 0.312 |
| python filter | 00:01:53.071 | 0.1% | 18520 | 0.713 | 6.105 | 30.203 |
| site send | 00:00:00.535 | 0.0% | 18339 | 0.000 | 0.029 | 0.186 |
| TOTAL: 24:01:36.417 | 24:01:20.868 | 100.0% | - | - | - | - |
INNfeed timer:
| Code region | Time | Pct | Invoked | Min(ms) | Avg(ms) | Max(ms) |
|---|---|---|---|---|---|---|
| article new | 00:00:00.000 | 0.0% | 0 | 0.000 | 0.000 | 0.000 |
| article prepare | 00:00:00.000 | 0.0% | 0 | 0.000 | 0.000 | 0.000 |
| article read | 00:00:00.000 | 0.0% | 0 | 0.000 | 0.000 | 0.000 |
| backlog stats | 00:00:00.001 | 0.0% | 3741 | 0.000 | 0.000 | 0.037 |
| callbacks | 00:00:00.000 | 0.0% | 0 | 0.000 | 0.000 | 0.000 |
| data read | 00:00:00.000 | 0.0% | 3 | 0.000 | 0.000 | 0.000 |
| data write | 00:00:00.000 | 0.0% | 3 | 0.000 | 0.000 | 0.000 |
| idle | 23:58:09.027 | 100.0% | 3741 | 17431.914 | 23065.765 | 24045.000 |
| status file | 00:00:00.000 | 0.0% | 6 | 0.000 | 0.000 | 0.000 |
| TOTAL: 23:58:09.065 | 23:58:09.028 | 100.0% | - | - | - | - |
nnrpd timer:
| Code region | Time | Pct | Invoked | Min(ms) | Avg(ms) | Max(ms) |
|---|---|---|---|---|---|---|
| hisgrep | 00:00:00.020 | 0.0% | 2 | 10.000 | 10.000 | 10.000 |
| idle | 00:00:00.000 | 0.0% | 0 | 0.000 | 0.000 | 0.000 |
| newnews | 00:00:00.000 | 0.0% | 0 | 0.000 | 0.000 | 0.000 |
| nntpwrite | 00:30:24.853 | 2.2% | 14453848 | 0.000 | 0.126 | 50.192 |
| readart | 00:00:00.050 | 0.0% | 2 | 25.000 | 25.000 | 25.000 |
| TOTAL: 22:35:00.623 | 00:30:24.923 | 2.2% | - | - | - | - |
Control commands to INND:
| Command | Number |
|---|---|
| flush | 5 |
| flushlogs | 2 |
| go | 1 |
| logmode | 2 |
| mode | 149 |
| name | 2 |
| pause | 1 |
| paused | 1 |
| reload | 2 |
| renumber | 1 |
| TOTAL: 10 | 166 |
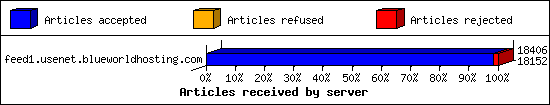
Incoming Feeds (INN):
| Server | Connects | Offered | Taken | Refused | Reject | %Accpt | Elapsed | |
|---|---|---|---|---|---|---|---|---|
| 1 | feed1.usenet.blueworldhosting.com | 9 | 18406 | 18152 | 0 | 254 | 98% | 24:17:06 |
| TOTAL: 1 | 9 | 18406 | 18152 | 0 | 254 | 98% | 24:17:06 | |
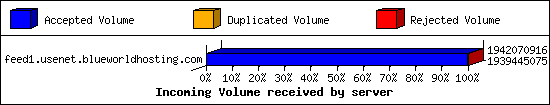
Incoming Volume (INN):
| Server | AcceptVol | DupVol | RejVol | TotalVol | %Acc | Vol/Art | |
|---|---|---|---|---|---|---|---|
| 1 | feed1.usenet.blueworldhosting.com | 1.8 GB | 0.0 KB | 2.5 MB | 1.8 GB | 99% | 103.0 KB |
| TOTAL: 1 | 1.8 GB | 0.0 KB | 2.5 MB | 1.8 GB | 99% | 103.0 KB | |
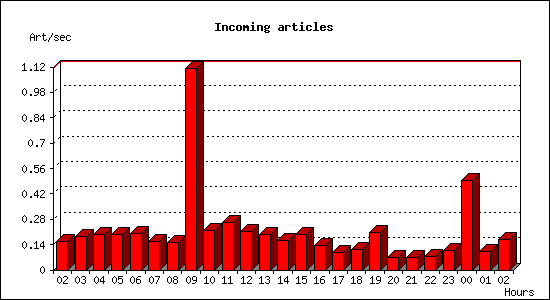
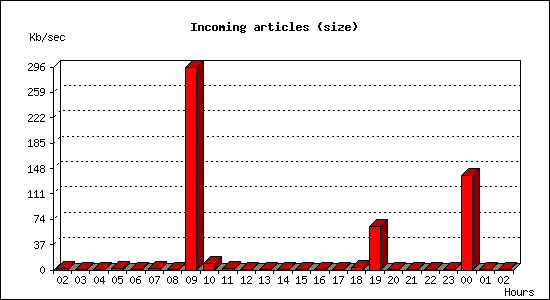
Incoming articles:
| Date | Articles | %Arts | Art/sec | Size | %Size | KB/sec |
|---|---|---|---|---|---|---|
| Jan 16 02:30:00 - 02:59:59 | 287 | 1.6% | 0.16 | 3.3 MB | 0.2% | 1.87 |
| Jan 16 03:00:00 - 03:59:59 | 657 | 3.6% | 0.18 | 3.0 MB | 0.2% | 0.85 |
| Jan 16 04:00:00 - 04:59:59 | 715 | 3.9% | 0.20 | 3.2 MB | 0.2% | 0.90 |
| Jan 16 05:00:00 - 05:59:59 | 702 | 3.8% | 0.20 | 6.1 MB | 0.3% | 1.74 |
| Jan 16 06:00:00 - 06:59:59 | 721 | 4.0% | 0.20 | 1.9 MB | 0.1% | 0.55 |
| Jan 16 07:00:00 - 07:59:59 | 570 | 3.1% | 0.16 | 5.2 MB | 0.3% | 1.47 |
| Jan 16 08:00:00 - 08:59:59 | 541 | 3.0% | 0.15 | 1.4 MB | 0.1% | 0.41 |
| Jan 16 09:00:00 - 09:59:59 | 3999 | 21.9% | 1.11 | 1.0 GB | 56.2% | 295.49 |
| Jan 16 10:00:00 - 10:59:59 | 776 | 4.3% | 0.22 | 34.1 MB | 1.8% | 9.69 |
| Jan 16 11:00:00 - 11:59:59 | 938 | 5.1% | 0.26 | 6.1 MB | 0.3% | 1.75 |
| Jan 16 12:00:00 - 12:59:59 | 770 | 4.2% | 0.21 | 2.2 MB | 0.1% | 0.62 |
| Jan 16 13:00:00 - 13:59:59 | 705 | 3.9% | 0.20 | 3.6 MB | 0.2% | 1.01 |
| Jan 16 14:00:00 - 14:59:59 | 586 | 3.2% | 0.16 | 4.3 MB | 0.2% | 1.23 |
| Jan 16 15:00:00 - 15:59:59 | 713 | 3.9% | 0.20 | 3.3 MB | 0.2% | 0.94 |
| Jan 16 16:00:00 - 16:59:59 | 487 | 2.7% | 0.14 | 1.6 MB | 0.1% | 0.46 |
| Jan 16 17:00:00 - 17:59:59 | 338 | 1.9% | 0.09 | 1.2 MB | 0.1% | 0.35 |
| Jan 16 18:00:00 - 18:59:59 | 403 | 2.2% | 0.11 | 14.4 MB | 0.8% | 4.10 |
| Jan 16 19:00:00 - 19:59:59 | 739 | 4.1% | 0.21 | 223.4 MB | 12.1% | 63.55 |
| Jan 16 20:00:00 - 20:59:59 | 250 | 1.4% | 0.07 | 771.3 KB | 0.0% | 0.21 |
| Jan 16 21:00:00 - 21:59:59 | 241 | 1.3% | 0.07 | 780.2 KB | 0.0% | 0.22 |
| Jan 16 22:00:00 - 22:59:59 | 266 | 1.5% | 0.07 | 907.4 KB | 0.0% | 0.25 |
| Jan 16 23:00:00 - 23:59:59 | 397 | 2.2% | 0.11 | 1.3 MB | 0.1% | 0.36 |
| Jan 17 00:00:00 - 00:59:59 | 1768 | 9.7% | 0.49 | 487.0 MB | 26.3% | 138.52 |
| Jan 17 01:00:00 - 01:59:59 | 372 | 2.0% | 0.10 | 1.2 MB | 0.1% | 0.33 |
| Jan 17 02:00:00 - 02:30:00 | 305 | 1.7% | 0.17 | 877.9 KB | 0.0% | 0.49 |
| TOTAL: 24:00:00 | 18246 | 100.0% | 0.21 | 1.8 GB | 100.0% | 21.92 |
Sites sending bad articles:
| Server | Total | Group | Dist | Duplic | Unapp | TooOld | Site | Line | Other | |
|---|---|---|---|---|---|---|---|---|---|---|
| 1 | feed1.usenet.blueworldhosting.com | 626 | 147 | 0 | 0 | 2 | 0 | 0 | 0 | 477 |
| TOTAL: 1 | 626 | 147 | 0 | 0 | 2 | 0 | 0 | 0 | 477 | |
Unwanted newsgroups [Top 20]:
| Newsgroup | Count |
|---|---|
| alt.binaries.pictures.purebeauty | 16 |
| alt.binaries.sounds.lossless | 15 |
| alt.binaries.pictures.scenic | 15 |
| finet.binaries.keskustelu | 13 |
| alt.binaries.test.yenc | 9 |
| alt.binaries.pictures.rail | 7 |
| alt.binaries.pictures.nude | 4 |
| alt.binaries.nospam.female.bodyhair | 4 |
| alt.binaries.movies.thelostmovies | 3 |
| alt.binaries.sounds.lossless.classical | 3 |
| alt.binaries.multimedia.cooking | 3 |
| alt.binaries.pictures.celebrities | 3 |
| alt.binaries.adan | 3 |
| alt.binaries.pictures.poultry | 2 |
| alt.binaries.sounds.lossless.jazz | 2 |
| gun.general | 2 |
| alt.religion.buddhism | 2 |
| alt.binaries.clip-art | 2 |
| bofh.transport.public | 2 |
| alt.binaries.pictures.earlmiller | 2 |
| TOTAL: 52 | 147 |
Supposedly-moderated groups with unmoderated postings [Top 20]:
| Groups | Count |
|---|---|
| misc.taxes.moderated | 2 |
| TOTAL: 1 | 2 |
INND Python filter [Top 20]:
| Reason | Count |
|---|---|
| EMP Body Reject | 35 |
| Bad From (hclaudioblanco@gmail.com) | 16 |
| Bad Subject (Buy Adderall) | 13 |
| Bad Subject (Buy Xanax) | 12 |
| Bad From (FBInCIAnNSATerroristSlayer@yahoo.com) | 10 |
| Bad Subject (Solution Manual ) | 10 |
| Bad Subject (Solution manual ) | 8 |
| Bad Subject (Buy adderall) | 1 |
| TOTAL: 8 | 105 |
Miscellaneous innd statistics [Top 10]:
| Event | Server | Number |
|---|---|---|
| Including strange strings | ||
| feed1.usenet.blueworldhosting.com | 372 | |
| TOTAL: 1 | 372 | |
| TOTAL: 1 | 372 | |
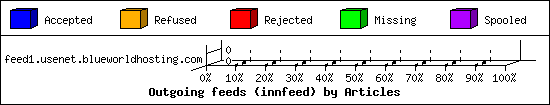
Outgoing Feeds (innfeed) by Articles:
| Server | Offered | Taken | Refused | Reject | Miss | Spool | %Took | Elapsed | |
|---|---|---|---|---|---|---|---|---|---|
| 1 | feed1.usenet.blueworldhosting.com | 0 | 0 | 0 | 0 | 0 | 0 | 0% | 00:10:01 |
| TOTAL: 1 | 0 | 0 | 0 | 0 | 0 | 0 | 0% | 00:10:01 | |
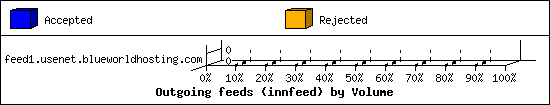
Outgoing Feeds (innfeed) by Volume:
| Server | AcceptVol | RejectVol | TotalVol | Volume/sec | Vol/Art | Elapsed | |
|---|---|---|---|---|---|---|---|
| 1 | feed1.usenet.blueworldhosting.com | 0.0 KB | 0.0 KB | 0.0 KB | 0.0 KB/s | 0 | 00:10:01 |
| TOTAL: 1 | 0.0 KB | 0.0 KB | 0.0 KB | 0.0 KB/s | 0 | 00:10:01 | |
NNRP readership statistics:
| System | Conn | Arts | Size | Groups | Post | Rej | Elapsed | |
|---|---|---|---|---|---|---|---|---|
| 1 | 023-084-030-207.res.spectrum.com | 62 | 2 | 4.1 KB | 0 | 0 | 0 | 00:33:44 |
| 2 | 208.100.26.230 | 4 | 0 | 0.0 KB | 0 | 0 | 0 | 00:00:38 |
| 3 | 104.156.155.32 | 96 | 0 | 0.0 KB | 0 | 0 | 0 | 00:00:21 |
| 4 | toma-03.stehlik.co.uk | 918 | 0 | 0.0 KB | 0 | 0 | 0 | 22:00:10 |
| TOTAL: 4 | 1080 | 2 | 4.1 KB | 0 | 0 | 0 | 22:34:54 | |
NNRP readership statistics (by domain):
| System | Conn | Arts | Size | Groups | Post | Rej | Elapsed | |
|---|---|---|---|---|---|---|---|---|
| 1 | *.res.spectrum.com | 62 | 2 | 4.1 KB | 0 | 0 | 0 | 00:33:44 |
| 2 | *.stehlik.co.uk | 918 | 0 | 0.0 KB | 0 | 0 | 0 | 22:00:10 |
| 3 | unresolved | 100 | 0 | 0.0 KB | 0 | 0 | 0 | 00:01:00 |
| TOTAL: 3 | 1080 | 2 | 4.1 KB | 0 | 0 | 0 | 22:34:54 | |
NNRP auth users [Top 20]:
| User | Conn |
|---|---|
| jesse | 62 |
| TOTAL: 1 | 62 |
NNRP total resource statistics [Top 20]:
| System | User(ms) | System(ms) | Idle(ms) | Elapsed |
|---|---|---|---|---|
| toma-03.stehlik.co.uk | 205.920 | 89.680 | 0.000 | 22:00:10 |
| 023-084-030-207.res.spectrum.com | 4.979 | 0.986 | 0.461 | 00:33:44 |
| 208.100.26.230 | 0.293 | 0.048 | 0.000 | 00:00:38 |
| 104.156.155.32 | 7.281 | 0.850 | 0.000 | 00:00:21 |
| TOTAL: 4 | 218.473 | 91.564 | 0.461 | 22:34:54 |
NNRP unrecognized commands (by host) [Top 20]:
| System | Conn |
|---|---|
| 208.100.26.230 | 1 |
| TOTAL: 1 | 1 |
NNRP unrecognized commands (by command) [Top 20]:
| Command | Count |
|---|---|
| GET / HTTP/1.0 | 1 |
| TOTAL: 1 | 1 |
NNRP client timeouts [Top 20]:
| System | Conn | Peer |
|---|---|---|
| 023-084-030-207.res.spectrum.com | 62 | 62 |
| 208.100.26.230 | 2 | 2 |
| TOTAL: 2 | 64 | 65 |